
Active management doesn't mean moving lines every day that creates chaos. It means having a process for specific Trigger Events. Market drift happens slowly. Recognizing the early signs your sales territory needs a refresh, such as high rep turnover or uneven lead response times, allows you to act before revenue is impacted."
The High Cost of the "Set It and Forget It" Trap

Most organizations operate on a "Q4 Sprint" cycle. They scramble in October to build a new sales territory alignment for January, and then default to adjusting sales territories, the following year.
Why? Because in legacy systems and Excel, making changes is painful. It breaks formulas, confuses payroll, and creates administrative chaos. Its a static view that's hard to share and adapt.
When to Act: The 3 Triggers of Realignment

The Old Way: Split the accounts alphabetically among the remaining team.
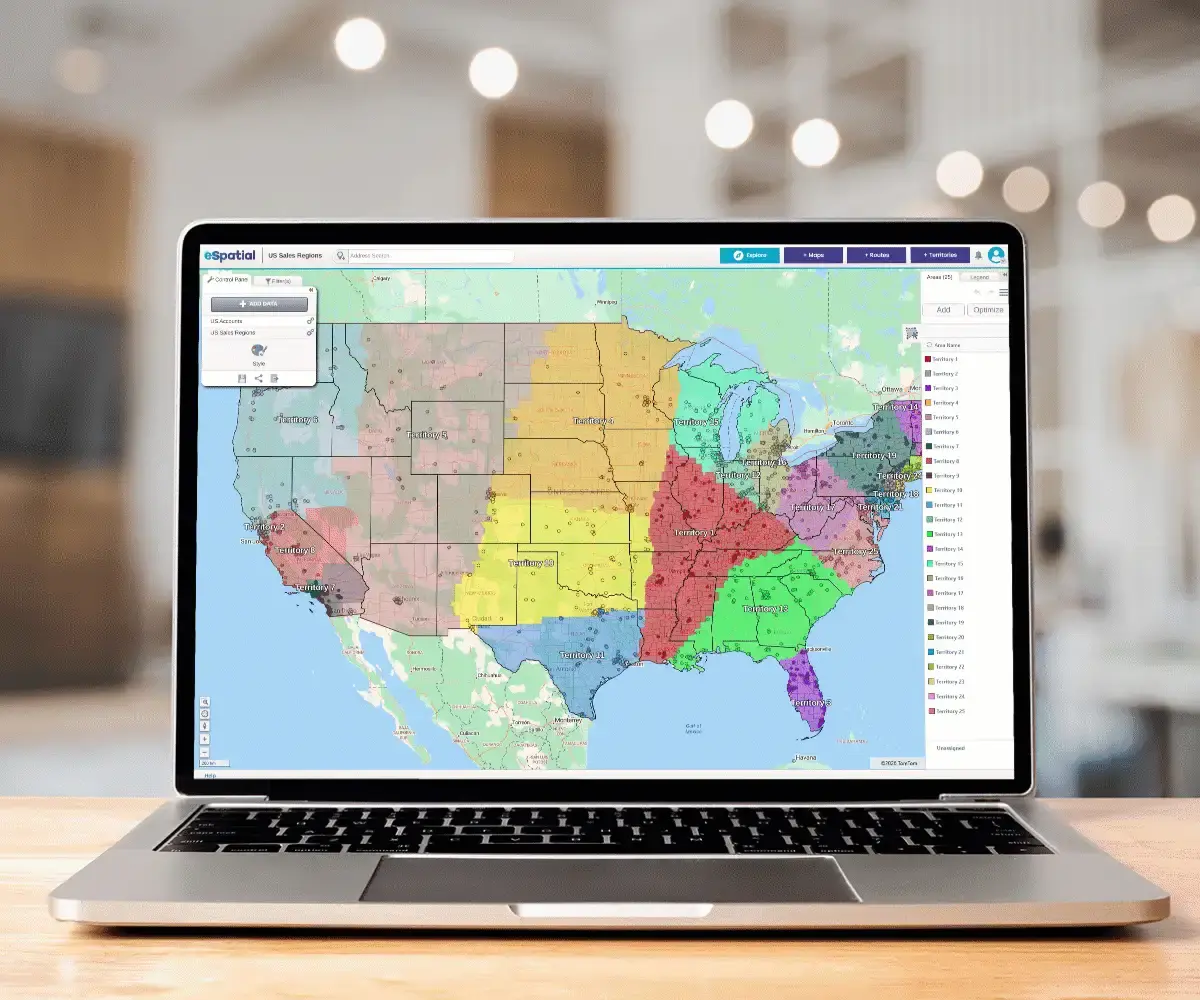
The Active Way: Instantly visualize the vacant territory with sales territory mapping software. Run a "What-If" scenario: Can the neighboring rep absorb this workload based on drive time? Or do we need to hire? You make a data-backed decision in minutes, not weeks.
Tip: If your "What-If" scenario shows a gap that requires a new hire, selecting a sales rep's ideal location becomes critical to minimizing travel costs and maximizing coverage.

The Old Way: Wait for the annual review to see who missed quota.
The Active Way: Monitor the Workload Index (from A practical guide to sales territory optimization and balancing). If a rep is at 150% capacity, execute a "Carve-Out." Take their bottom 20% of accounts (prospects) and move them to a newer rep. This protects the veteran's time for high-value closing while ensuring prospects get worked.
Tip: Our sales capacity planning guide can help to ensure your reps have the bandwidth to maintain high-value closing rates.

The Old Way: Strategy shifts (e.g., "Focus on Healthcare"), but reps are stuck in geo-based territories with few hospitals.
The Active Way: Overlay "Healthcare Prospects" onto your current map using sales territory planning tools. Re-balance territories to ensure every rep has a fair share of the new target vertical.
Tip: When pivoting to new markets, you need strategies for growing your sales territory without overextending your current team.
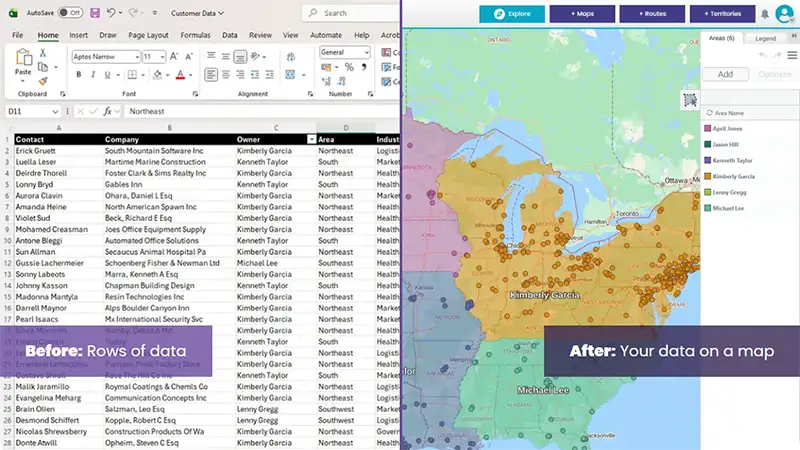
Why You Can't Do This in Excel

We cannot stress this enough: Spreadsheets are static. They cannot calculate how a mid-year change affects a rep's drive time. They cannot visualize how a new hire impacts the "white space" coverage in a region. To master active territory management, you need a territory map maker tool that handles Hierarchy Management.
When you split a territory at the street level, does that revenue roll up to the right District Manager? Does it reflect in the Regional VP’s forecast? Modern software ensures that every small adjustment at the bottom automatically aligns with the complex reporting structures at the top. No broken formulas, just a single source of truth.
Territory Mapping Solutions
-
 Sales Territory Design
Move beyond basic boundaries. Use data-driven insights to build geographic, account-based, or hybrid models that align your sales team with maximum market potential. Turn territory design into a competitive advantage that boosts revenue and rep retention.
-
 Optimization & Balancing
Shift from "equal" to "equitable" territories. Use workload-based optimization to prevent rep burnout and eliminate lost revenue from unserviced accounts. Balance hundreds of territories in minutes to ensure every rep has a fair path to quota.