Aggregate by Value Tool


Group, analyze, and visualize location data by the values that matter to your business

Quick answer

The Aggregate by Value tool lets you group, merge, and summarize your spatial data based on specific attributes. This allows you to spot trends, compare regions, and make smarter decisions in less time.

In this article, you'll learn:

  • What is value aggregation, and how can it help my sales strategy?
  • How do I go about using the aggregate by value tool?
  • What are some great use cases for this tool?
  • Which other eSpatial tools can be used when you aggregate valuation?

What is Value Aggregation?


Value aggregation is the process of combining and summarizing data values within a specific geographic area. This could be a sales territory, postcode, or region. For example, if you map customer locations with sales data, aggregating by value can calculate the total sales revenue, average deal size, or number of accounts within each territory.

Why Use the Aggregate by Value Tool?


The tool helps users quickly identify patterns, prioritize high-value areas, and make data-driven decisions about resource allocation, territory design, or sales strategy.

Group your data

Group Your Data

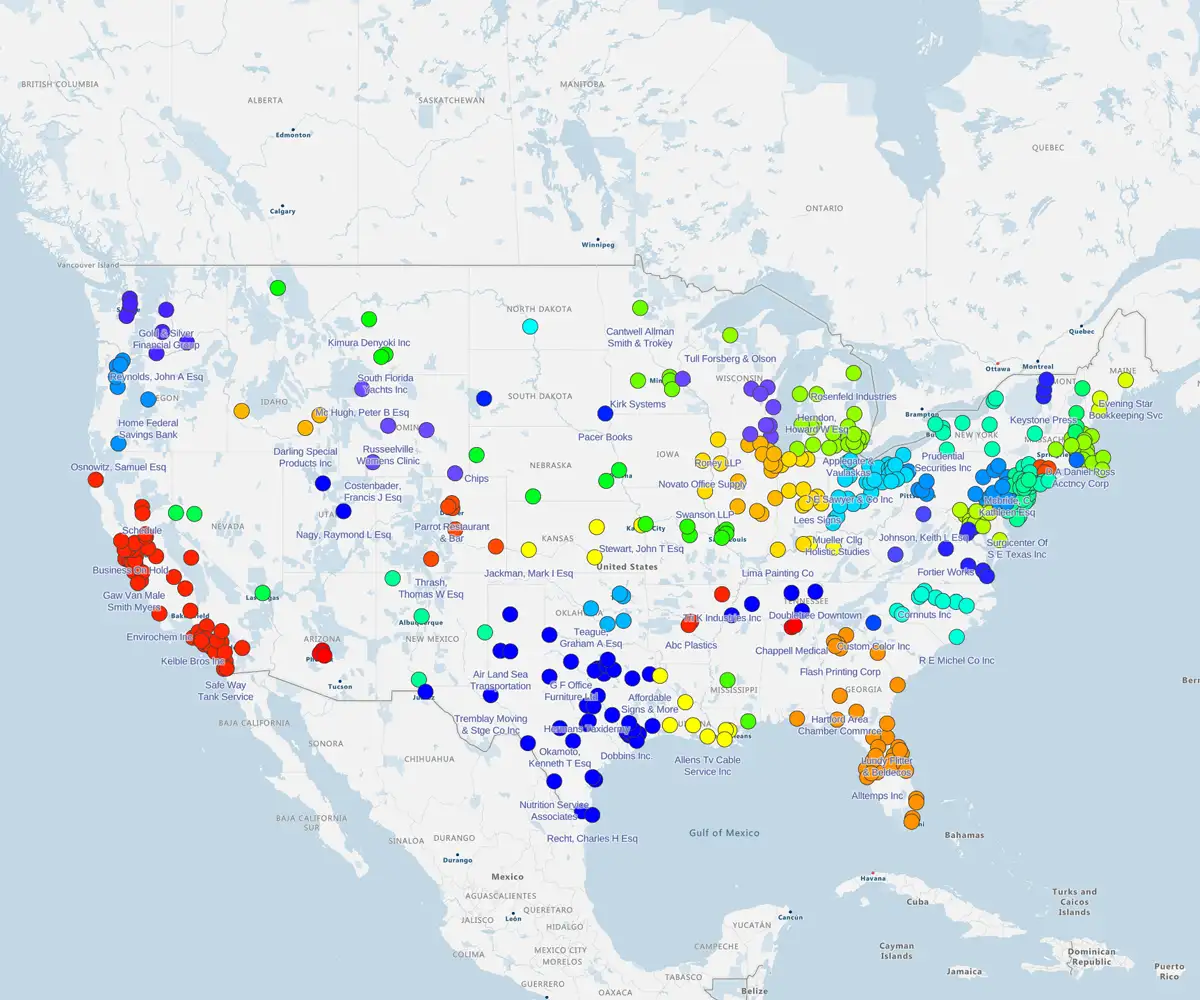
The Aggregate by Value tool allows you to group data points on a map based on shared attributes. For instance, you can aggregate sales data from multiple locations by sales territory or product category.

A typical query might be to aggregate (or combine the product sales data of multiple areas) product sales within a sales region.

Summarization of map data

Summarization

The tool summarizes the data for each group after aggregating, based on selected metrics like sum, average, median, or count. It is immensely helpful in making sense of diverse data sets, such as the total revenue from different regions or the average number of insurance claims in various cities.

Visualization of aggregated data

Visualization

The data can be summarized and presented through visual maps like heat maps or cluster maps, which are available in eSpatial. The visualizations help you uncover new (and possibly hidden) insights in your raw data.

What Are the Use Cases for Aggregate by Value?


  • Sales planning: Revenue operations might aggregate sales or product sales data by state, county, Zip, or territory and identify new growth opportunities
  • Market planning: Marketing operations might aggregate campaign or event data by state, county, Zip, or territory and identify new growth opportunities
  • Urban planning: Planners might aggregate population data by neighborhoods to determine where services or infrastructure improvements are needed
  • Retail analysis: Businesses can aggregate sales data by ZIP code or region to identify high-performing areas and adjust marketing strategies accordingly
  • Public health: Health officials could aggregate disease incidence rates by locality to identify outbreaks and allocate medical resources more effectively
  • Environmental studies: Researchers can aggregate pollution levels by geographic regions to identify areas of high contamination and correlate these with potential sources

Get Started With eSpatial Today

Whether aggregating sales figures, analyzing customer distribution, or refining your territories, eSpatial gives you the tools to do it faster and smarter. Start by exploring your data with the Aggregate by Value tool, then dig deeper with eSpatial's advanced mapping tools and software.

Create a map with eSpatial in just minutes and discover how easy it is to make smarter business decisions backed by powerful location intelligence.

You appear to be offline at the moment, this notice will disappear once your device can connect to the internet again