Introduction
You've been there. Juggling spreadsheets filled with customer addresses, team member locations, and potential event sites, trying to piece together the most efficient plan. The C-suite is asking, "How can we reduce fuel costs and improve service delivery times?" and you're stuck in a maze of cells and formulas, trying to find an answer. It feels less like strategic planning and more like a never-ending game of chess. You know there's a more efficient way, but your current tools are holding you back.
What if you could see your entire operation on a single, dynamic map? Imagine, at a glance, identifying the most efficient routes for your field teams, pinpointing the perfect location for your next service center, and ensuring your resources are exactly where they need to be.
This guide is designed to bridge the gap between your strategic goals and the daily complexities of your role. We'll show you how to use mapping software to make confident, data-driven decisions that cut costs, boost productivity, and get immediate buy-in from leadership. It's time to turn your complex data into a clear operational advantage.
-
1. New reality
Why spreadsheets are slowing you down
View chapter about "1. New reality" -
2. Raw data
How to get from
View chapter about "2. Raw data"
data to decision -
3. Questions to ask
Answering your
View chapter about "3. Questions to ask"
toughest questions -
4. Business case
From cost center
View chapter about "4. Business case"
to profit driver
Chapter 1
The New Operational Reality Why Spreadsheets Are Slowing You Down

1. What is Mapping Software for Operations Managers?
For you, mapping software is a command center for your entire operation. It's a tool that takes your disparate location data—from customer addresses, team locations and potential site addresses—and transforms it into a living, interactive map. This isn't just about seeing where things are; it's about understanding the relationships between them to make smarter, faster decisions.

2. Hidden Costs of Manual Planning
Your reliance on spreadsheets comes with a hefty price tag. The hours spent manually planning routes, the wasted fuel from inefficient journeys, and the opportunity cost of not being able to quickly identify service gaps all add up. This manual approach is not just inefficient; it's a barrier to growth.

3. Power of a Location-based Approach
By visualizing your data on a map, you can uncover hidden patterns and opportunities that are impossible to see in a spreadsheet. This visual approach allows you to move from being reactive to proactive, anticipating challenges and capitalizing on opportunities before your competitors do.

4. Real-world Scenarios
- Field team routing: Instead of manually plotting routes, imagine automatically generating the most efficient, multi-stop routes for your entire field team with a single click. You can even adjust routes in real-time based on new service calls or changing traffic conditions.
- Resource network planning: Visualize your current service network and customer locations to identify underserved areas. This allows you to strategically place new resources, whether it's a new warehouse or a new service hub, to minimize travel time and maximize coverage.
- Event/site location selection: Planning a user conference or opening a new office? Overlay demographic data, customer locations, and competitor locations on a map to find the optimal site that will attract the most attendees or customers.
How It Works
Step 1
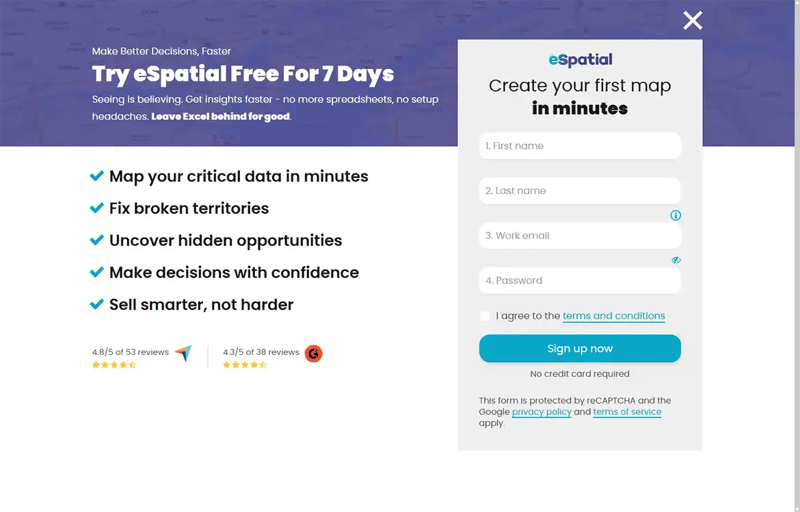
Sign up & Upload
Your Data
Create a free account on our website, no credit card required. Then, upload your data from spreadsheets, CRMs, or other sources. eSpatial supports multiple file types, so you can get started quickly with minimal prep.
Step 2
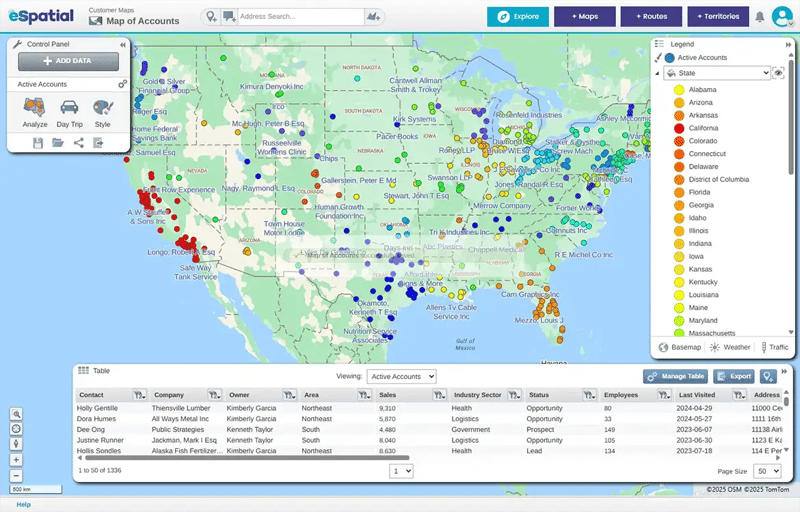
Map And
Customize
Plot your data points like stores, clients, or assets on an interactive map. Use built-in filters, labels, and styling tools to highlight trends, customize views, and layer in details like sales territories or customer segments.
Step 3
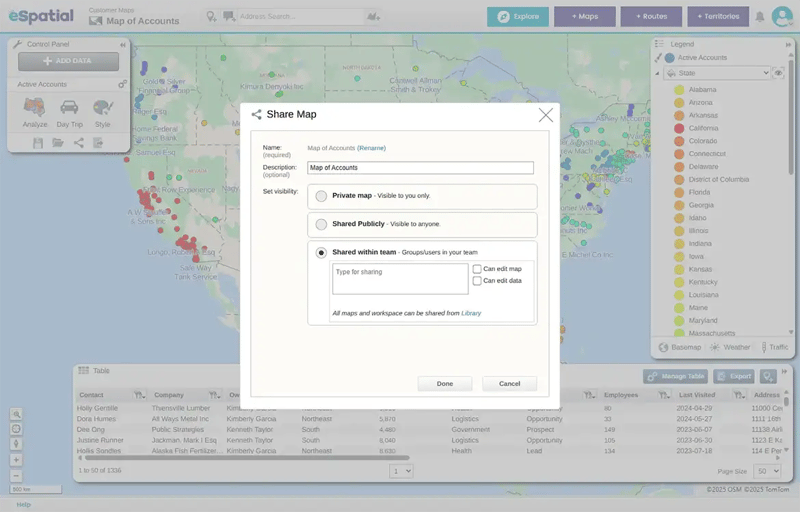
Analyze And
Share Insights
Leverage powerful analytics to create heat maps, territory plans, or optimized routes. Easily share your visual insights through exportable formats or interactive maps to accelerate decision-making across your team.
Chapter 2
From Raw Data to Real-world Routes Getting Started

1. Your Data is Your Roadmap
The foundation of effective operational planning is clean, accurate data. The good news is, you likely already have the data you need. The key is to consolidate it and put it to work.

2. Key Data Sources for Operational Mapping
- Customer Relationship Management (CRM) System (e.g. Salesforce)
- Human Resource Information System (HRIS)
- Enterprise Resource Planning (ERP) system
- Simple spreadsheets with addresses and operational data
- Customer location data

3. Putting Your Operations on the Map
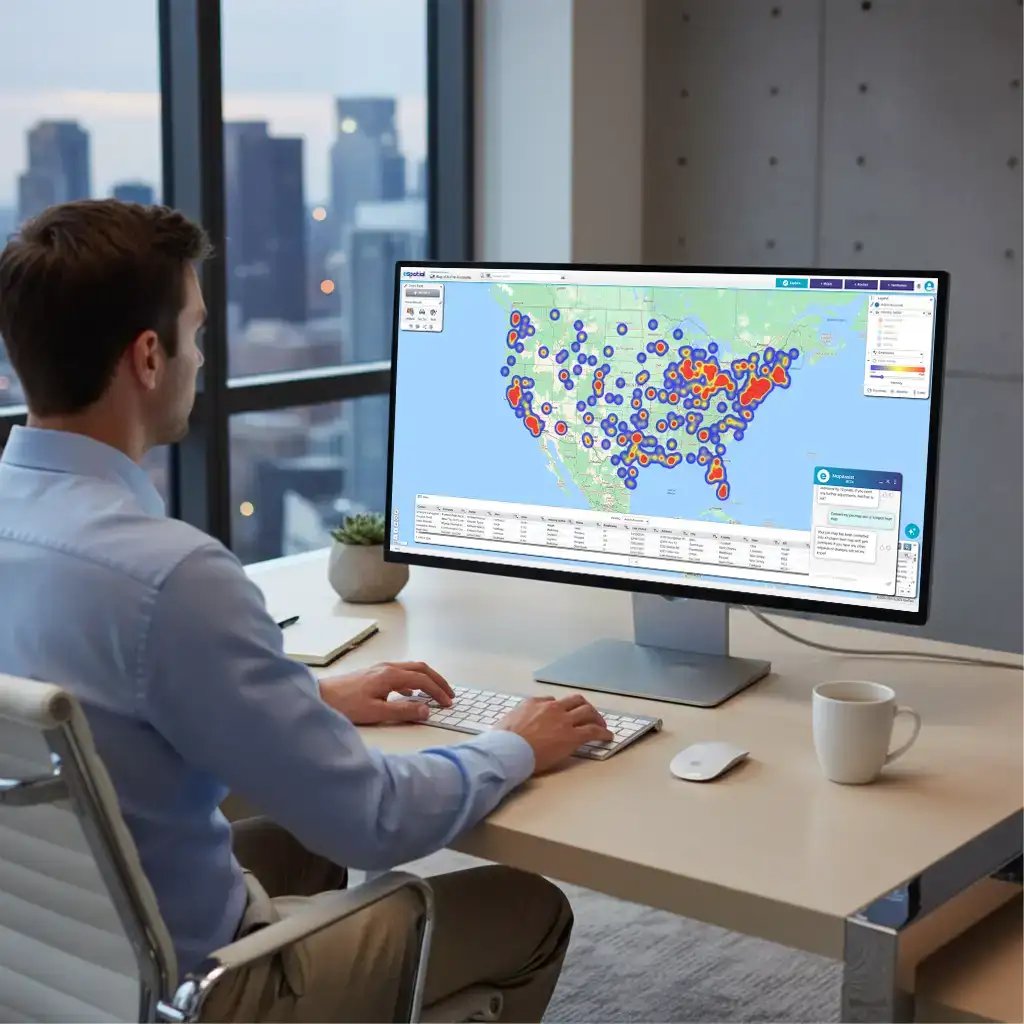
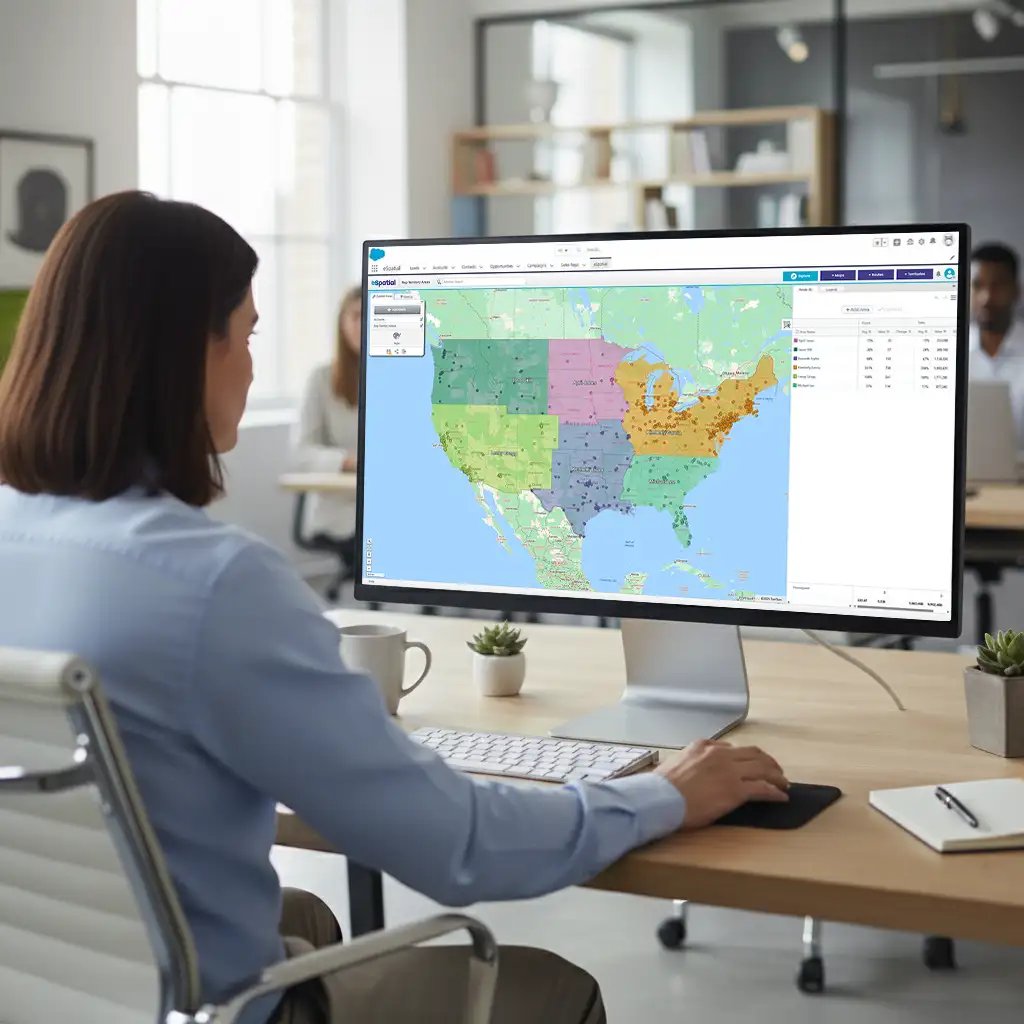
Modern mapping software like eSpatial makes it easy to upload your data and instantly see it on a map. What was once a list of addresses becomes a clear, visual representation of your operational landscape.
4. Visualizing Efficiency and Opportunity
Once your data is on the map, you can start to layer on additional information to gain deeper insights. Visualize service areas, color-code customers by value, and create heatmaps to see where your services are most concentrated.
Chapter 3
Unlocking Operational Excellence Answering Your Toughest Questions

1. Are Our Field Teams Running the Most Efficient Routes?
With routing optimization tools, you can answer this question with a definitive "yes." By analyzing all possible routes, the software can identify the most efficient path, taking into account factors like traffic, time windows, and vehicle capacity.

2. Where Are the Gaps in Our Service Network?
By mapping out your current customers and service locations, you can quickly identify areas where you have a high concentration of customers but limited service coverage. This is a clear indicator of where you need to expand your network.

3. What's the Optimal Location for Our Next Event or Site?
Location analysis tools allow you to overlay various datasets to find the perfect spot. You can analyze drive times, use buffer maps, demographic data, and proximity to your existing customers to make a data-backed decision.

4. How Can We Better Balance Workload Across Our Teams?
Territory mapping software allows you to create balanced territories for your field teams, ensuring that each team member has an equitable workload and a fair opportunity for success. This not only improves morale but also boosts productivity.
Chapter 4
Making the Business Case From Cost Center to Profit Driver

1. From Reactive Problem-solving to Proactive Strategy
Mapping software empowers you to shift from constantly putting out fires to strategically planning for the future. You can model different scenarios, anticipate challenges, and make proactive decisions that give your organization a competitive edge.
2. Aligning Operational Improvements With Revenue Goals
Every dollar you save in operational costs is a dollar that goes straight to the bottom line. By demonstrating how more efficient routing, better resource allocation, and strategic site selection can impact revenue, you can make a powerful case for investment.

3. Presenting Your Optimization Plan
Visuals are a powerful tool for communication. Instead of presenting a spreadsheet, imagine showing your leadership team an interactive map that clearly illustrates the "before" and "after" of your proposed operational improvements.

4. Getting Buy-in for a Smarter Way of Working
When you can clearly demonstrate the ROI of your initiatives with compelling visuals and hard data, getting buy-in from leadership becomes a much easier conversation. You're no longer just asking for a new tool; you're presenting a clear plan for a more efficient and profitable future.
Choosing the Right Mapping Software
A Checklist for operational success
Item 1
Key Features for Operations
Look for features like route optimization, territory management, location analysis, and data visualization tools that are specifically designed for the challenges you face.
Item 2
Is It User-friendly for Your Team?
The best software is the software your team will actually use. Look for an intuitive interface and a gentle learning curve to ensure rapid adoption.
Item 3
Can It Integrate With Your Existing Systems?
Seamless integration with your CRM, ERP, and other systems and easy import for your Excel or CSV’s for maintaining a single source of truth and automating data updates is essential.
Item 4
Will the Vendor Support Your Operational Needs?
Choose a vendor that understands the unique challenges of operations and can provide expert support and guidance to help you succeed.
Item 5
Does It Handle Your Data Volume and Geocoding Needs?
As your operations grow, so will your data. Ensure the software can scale with your needs and offers unlimited geocoding to convert your addresses into map coordinates.
Item 6
Other Items to Assess
- Performance: How quickly do the maps load and refresh?
- Scalability: Can the system grow with your business?
- API: Does it offer an API for custom integrations?
- Mobility: Can your team access maps from their mobile devices?
Conclusion
For too long, operations management has been a constant struggle with logistical puzzles and inefficient workflows. But it doesn't have to be this way. By moving beyond the limitations of spreadsheets and embracing the power of mapping software, you can transform your role from a tactical problem-solver to a strategic leader. This is the most effective way to turn your operational data into a visual story that cuts costs, boosts efficiency, and drives your organization forward.

