eSpatial gives data analysts a platform to move beyond static spreadsheets. Patterns and trends otherwise hidden in rows of numbers emerge with dynamic maps and map data visualization. This lets you draw impactful conclusions that drive business value.
Our Customers Love Mapping With eSpatial
See What eSpatial Can Do for Data Analysts
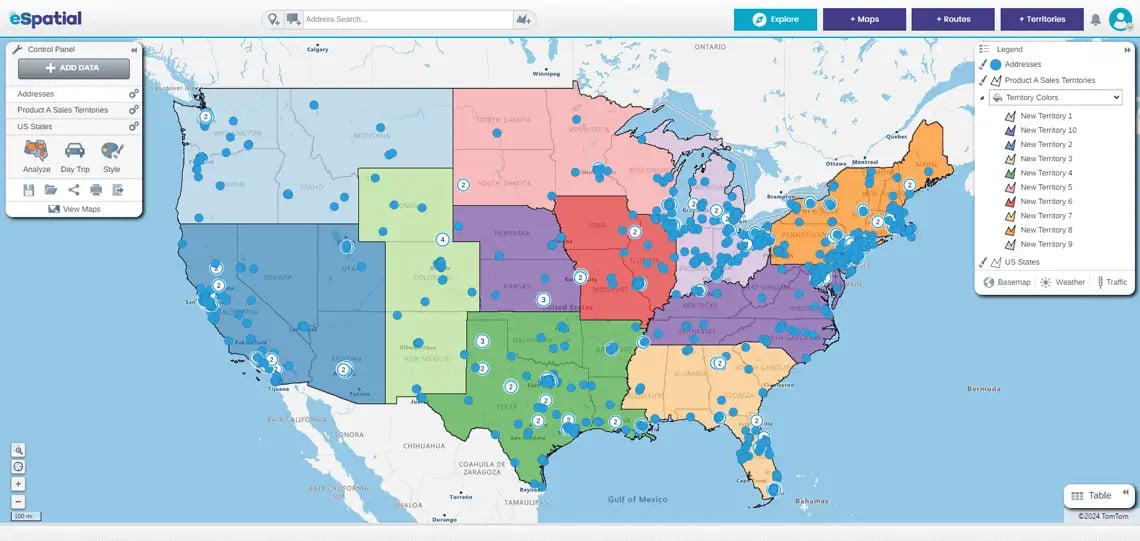
Create Powerful Map Visualizations
Data analysts often struggle to extract geographic meaning from rows of spreadsheet data. eSpatial’s data mapping solution solves this by transforming datasets into intuitive visual formats like heat maps, territory maps, and point maps. These types of map data visualization help reveal what raw numbers can’t, no matter if you’re analyzing customer distribution or evaluating sales performance.

Uncover Patterns With Spatial Analysis
Traditional BI tools can make it difficult to identify spatial trends and regional patterns. eSpatial’s data mapping tool, however, makes it easy to spot clusters, outliers, and correlations through tools like hotspot analysis and radius filtering. These spatial analytics capabilities support decisions about market expansion, site selection, and performance optimization.
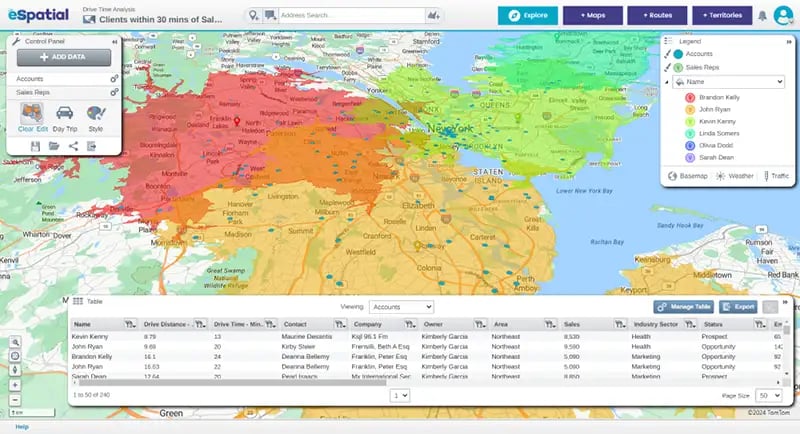
Make Data-backed Decisions Faster
Speed up your strategic decision-making with location-based insights. eSpatial helps you evaluate scenarios like new site selection, territory alignment, or disaster response planning—using interactive maps and spatial analysis to support smarter, faster choices. With visual clarity and real-time context, your team stays agile and aligned.

Present and Share Insights Visually
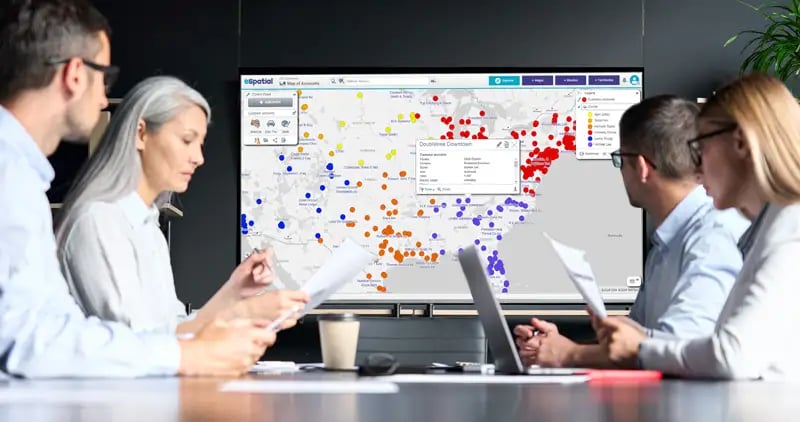
Without the right tools, explaining geographic insights to stakeholders can be challenging. eSpatial gets analysts visualizing data with software, enabling them to build clear, visual narratives with interactive maps and shareable dashboards. Map data visualization enhances stakeholder understanding, from justifying site selection to showing territory performance.
4 Reasons Data Analysts
Choose eSpatial
-
Fast spatial insights
Uncover location-based trends in minutes
-
Easy to get started
Build your first map in minutes. No coding or GIS experience required
-
Flexible mapping toolkit
Choose from heat maps, territory maps, buffer zones, and more
-
Data-driven storytelling
Turn complex datasets into clear, visual narratives that drive decision-making
Platform Features That Make
Spatial Analysis Simple
eSpatial scales with your organization’s data and complexity. It’s the ideal complement to traditional BI tools, helping surface spatial patterns that would otherwise be missed.
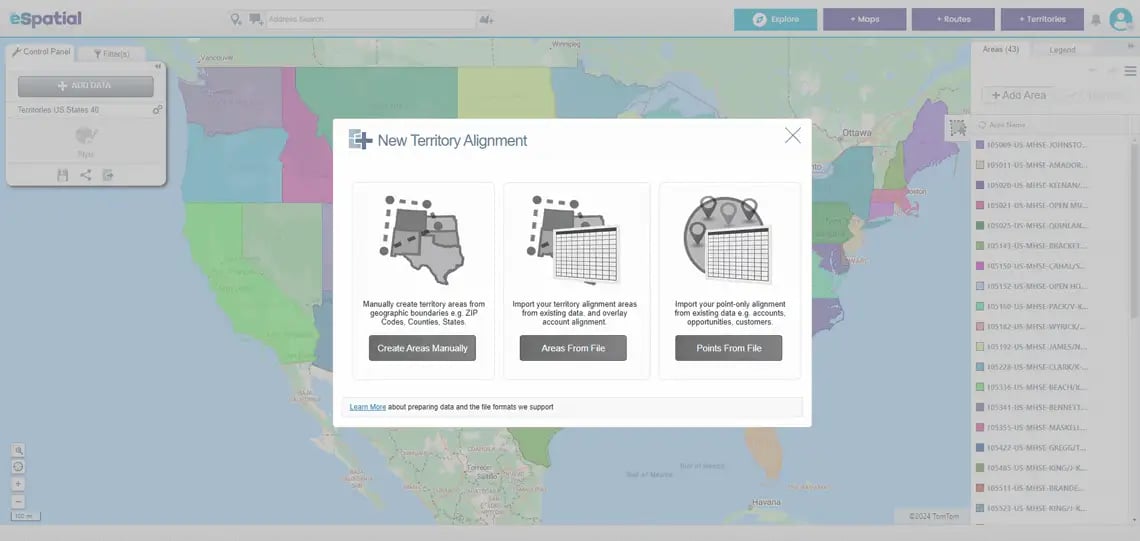
Seamless Integration
eSpatial connects with your favorite tools to streamline workflows. Easily import data from Excel, Salesforce, or cloud-based systems. Updates are fast and automatic, keeping your maps in sync with your source data.

User-friendly Interface
You don't need to be a tech expert to harness the power of our mapping software. Designed with usability, eSpatial’s interface allows you to hit the ground running with a platform accessible to all expertise levels. Intuitive features mean less training and more time to improve your operations.
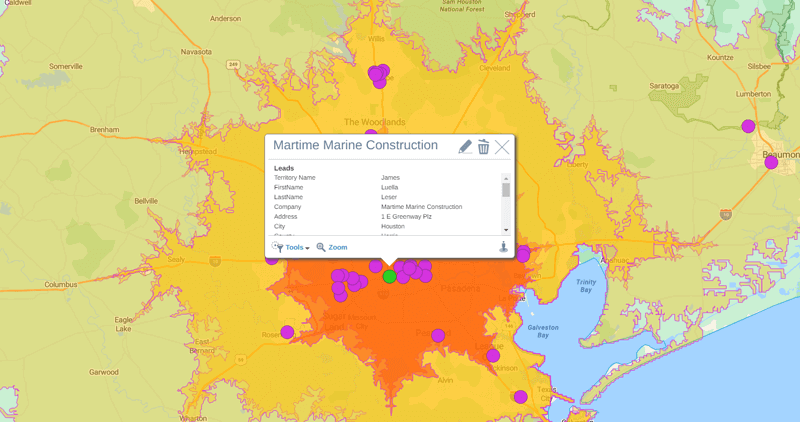
Advanced Analytics
Move beyond static maps and charts. With tools like drive-time zones, proximity reporting, and buffer analysis, you can visualize complex data relationships, uncover patterns, and plan with precision.
Scalable and Flexible
Whether you're handling thousands or millions of records, eSpatial delivers high performance and reliability. Its flexible architecture supports your organization's growing teams, multiple departments, and diverse mapping needs.
Explore eSpatial Today
Get started with eSpatial’s data visualization maps through a free trial and explore a full suite of mapping and analysis tools. The platform is designed for fast, practical use and includes many tools, such as drag-and-drop data uploads and customizable visualizations. With no steep learning curve, analysts can extract insights from day one.
Frequently Asked Questions
Why Use Maps for Data Analysis?
Data visualization maps help reveal patterns, relationships, and trends that are hard to see in spreadsheets. Visualizing your data geographically provides added context and insight. It enables smarter, faster decision-making for analysts and stakeholders alike.
What Types of Data Can I Import Into eSpatial?
eSpatial supports various data formats, including Excel, CSV, and direct connections from CRM platforms. You can import customer locations, sales data, and demographic stats. The platform makes data onboarding quick and seamless.
Can I Create Different Types of Map Visualizations?
Yes, eSpatial’s data visualization platform supports many visualizations, including heat maps, point maps, and territory maps. You can also apply filters, color coding, and custom markers. This flexibility helps you tell your data’s story your way.
Can I Share Maps or Visualizations With Others?
Absolutely. eSpatial allows you to share maps through interactive dashboards, embed them in presentations, or export them as images or PDFs. Teams can collaborate and act on shared geo analytics insights efficiently with this mapping data visualization tool.
How Large Can My Dataset Be?
eSpatial’s data mapping software is built to handle large datasets with millions of records. The platform is optimized for speed and performance at scale. Whether your dataset is small or massive, eSpatial delivers consistent results.


