


Operational excellence happens when your central strategy aligns perfectly with the physical movement of your teams and assets.
Abstract Data vs. Visual Spatial Clarity
Data View
Standard CRM/BI Stack: Rows, columns, static dashboards, and ZIP code lists.
Location Intelligence: Dynamic geographic layers, drive-time contours, and interactive visual maps.
Cognitive Load
Standard CRM/BI Stack: High, requires manual mental geometry and cross-referencing flat files.
Location Intelligence: Low, patterns, whitespace, and account density are immediately obvious.
Alignment Velocity
Standard CRM/BI Stack: Weeks of manual spreadsheet modeling and endless revision cycles.
Location Intelligence: Live scenario testing and real-time stakeholder consensus.
Operational Impact
Standard CRM/BI Stack: Hidden travel drag, rep boundary disputes, and missed quota potential.
Location Intelligence: Mathematically balanced workloads, optimized field routes, and maximized selling capacity.
The Three Pillars of Spatial Ops
1. Mapping Software
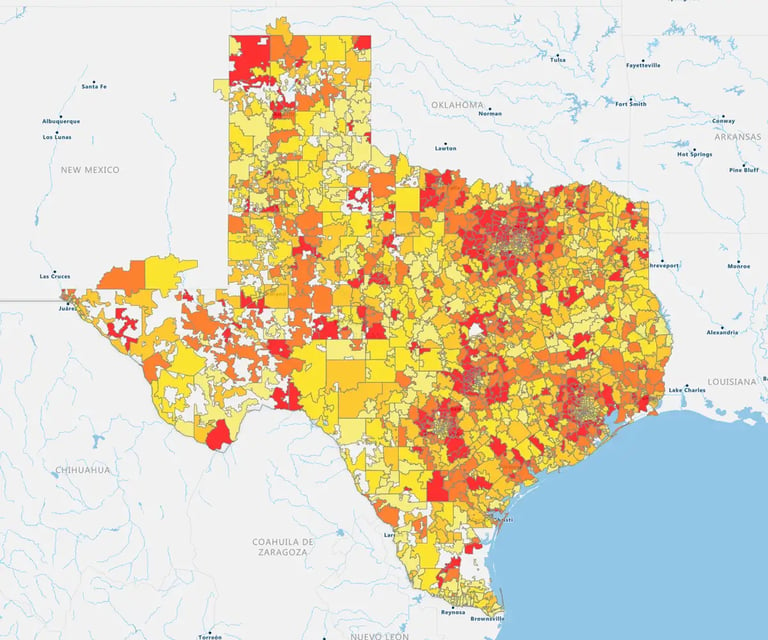
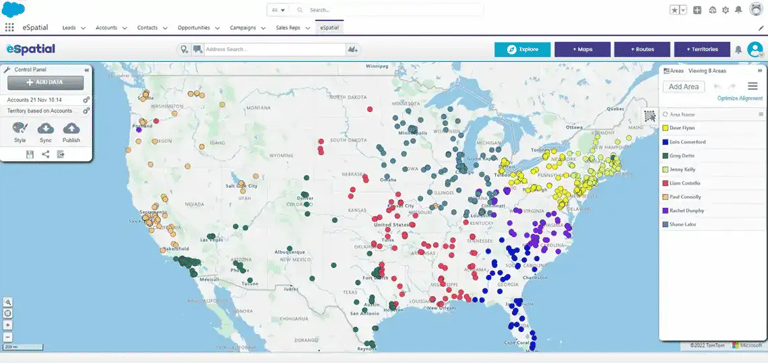
Converts flat CRM records and spreadsheets into clear visual hotspot, pin, bubble or drivetime maps. You can spot underserved markets, account concentration, and revenue gaps instantly, without waiting on internal technical or GIS teams.
2. Territory Mapping Software
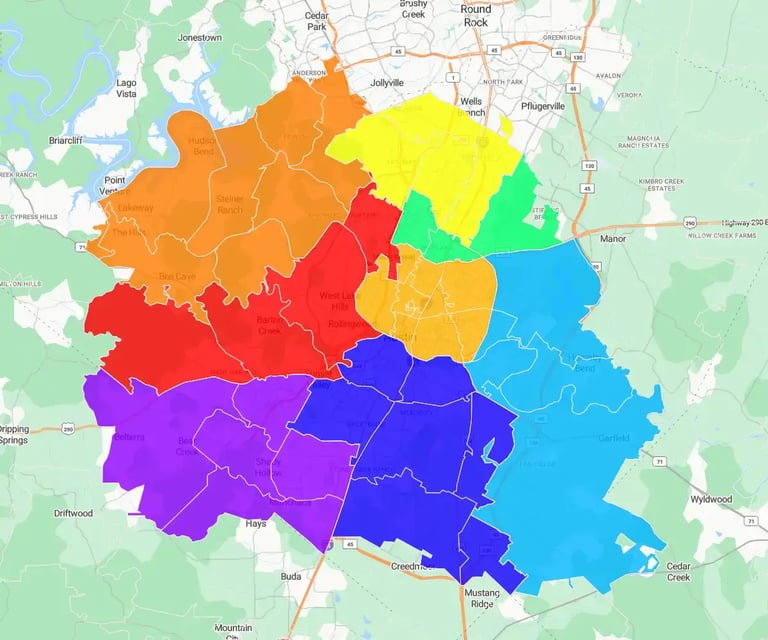
Acts as an objective decision engine built on direct, bi-directional Salesforce CRM integration. Or use it independently of your CRM.
You can balance sales regions by true workload constraints, model "what-if" boundary shifts live in front of sales managers, and write approved changes straight back to Salesforce standard or custom territory objects.
3. Route Planning Software
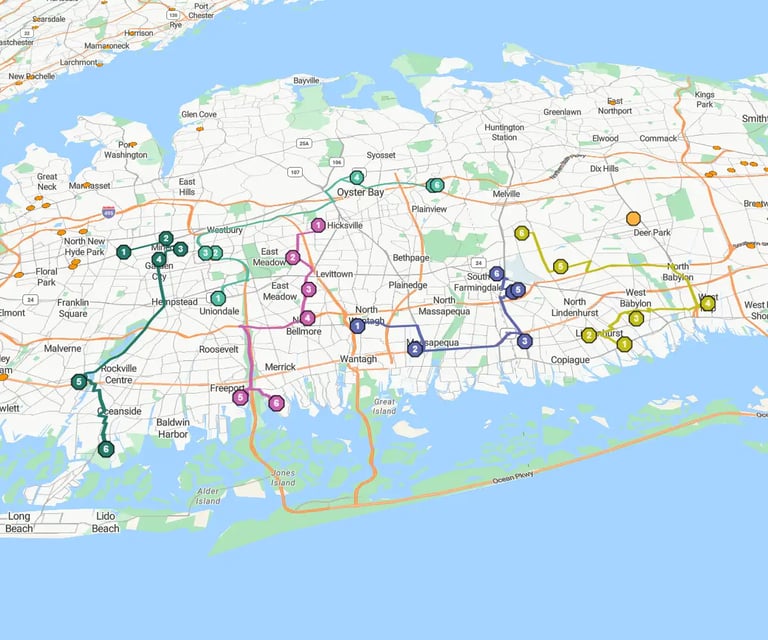
Replaces "as-the-crow-flies" radial buffers with true Isochrone drive-times based on actual road networks. Field reps build daily schedules around anchor accounts, cutting windshield time by 30% and maximizing customer face-time.
Map Types & ROI Matrix
|
Map Type |
Core Capability |
Primary Sales Ops Use Case |
Commercial Impact & ROI Metric |
|---|---|---|---|
|
Pin Maps |
Interactive markers color-coded by account stage or owner. |
Visualizing account density and identifying overlapping rep assignments. |
Eliminates account collisions and accelerates pipeline reviews. |
|
Heatmaps |
Density modeling showing activity clusters. |
Spotting underserved territories and evaluating market penetration. |
Cuts project planning times by 95% by targeting true demand hotspots. |
|
Proportional Bubbles |
Sized markers reflecting revenue magnitude. |
Prioritizing high-value accounts during territory rebalancing. |
Unlocks targeted cross-selling and focuses rep time on top accounts. |
|
Drive-Time |
Polygon buffers calculated using real road networks. |
Multi-stop daily trip optimization and field capacity planning |
Reclaims up to 30% in field selling time and reduces fuel costs. |
|
Territory maps |
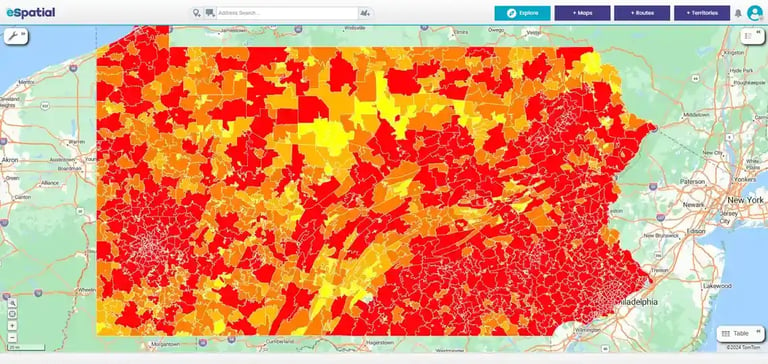
Polygon boundary layers mapped to zip codes or DMAs. |
Designing balanced, non-overlapping territories and testing scenarios. |
Slashes territory realignment cycles from weeks down to hours. |
Everyday Sales Ops Use
Cases & Enterprise Proof
Territory Realignment Velocity
Siemens compressed territory realignment cycles from weeks down to hours using automated spatial balancing, protecting field selling time during major organizational shifts.
Revenue Activation
Thermo Fisher Scientific unlocked $30M in untapped sales potential by rebalancing specialized sales groups live in front of key stakeholders.
Field Efficiency & Onboarding
Henkel cut new sales rep onboarding times by 67% and reclaimed 30% of field selling time by equipping reps with interactive prospect and territory maps.
Cost Elimination & Fulfillment
Lauren Concrete eliminated proximity bias by mapping total operational and material costs rather than simple distance, unlocking $1.7M in shipping savings.
Strategic Reporting
Nortek Air Solutions compressed monthly sales reporting cycles from days to 20 minutes while delivering executive-ready visual heatmaps.
Workload Balance
A major manufacturing leader captured a baseline 3% revenue lift by balancing inside and outside rep workloads using spatial intelligence.
Overcoming the Realignment Paradox:
Spreadsheets vs. Visual Collaboration
According to research from the Sales Management Association (SMA), over 80% of organizations actively avoid regular territory realignments out of fear of disrupting sales teams and customer relationships.
Yet relying on spreadsheets creates a massive performance deficit: firms using specialized territory software achieve an 86% company revenue target attainment rate compared to just 46% for spreadsheet users, while driving individual rep quota attainment from 52% up to 68%.
Furthermore, while 83% of sales leaders state that balancing workload is critical, only 44% can execute it effectively on spreadsheets.
Ready to Optimize Your Field Operation?
Book a Strategy Session with an eSpatial Expert to see your "Full Pie" of operational potential.
Spreadsheets vs. eSpatial
The Realignment Workflow

Workload Balancing
The Spreadsheet: You balance purely on account count or revenue in Excel. You miss physical travel distance, drive-time density, and call frequency. One rep gets a compact metro area; another gets a massive rural patch with identical revenue but triple the driving hours.
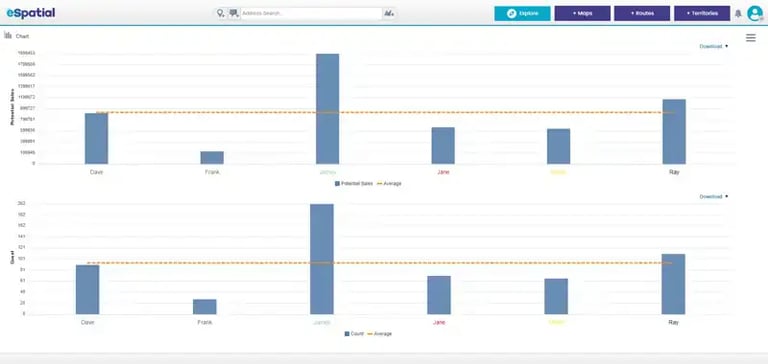
The eSpatial Method: The Workload Index balances account count, active pipeline, historical revenue, and true drive-time effort simultaneously. Workload equality is mathematically calculated and visually verified.

Scenario Modeling
The Spreadsheet: Changing one boundary requires fixing broken formulas, updating pivot tables, and manually re-checking account assignments. Testing three options takes days of tedious admin.
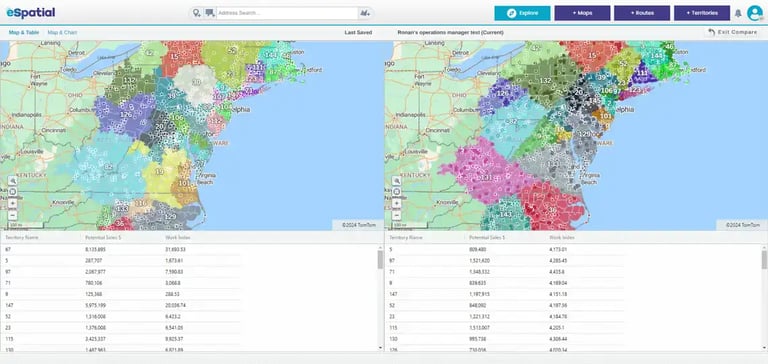
The eSpatial Method: You build live "what-if" scenarios in minutes. Adjust a boundary line on an interactive map, and the platform recalculates total revenue, rep workload, and account density across all affected territories in real time.

Stakeholder Consensus
The Spreadsheet: You present static spreadsheet rows or flat slide decks to sales managers. Managers argue over zip codes, suspect unfairness, and fight over commission impacts. Approvals stall for weeks.
The eSpatial Method: You host a live screenshare session with sales managers, HR, and leadership. Everyone views the same interactive map, exploring boundary shifts live and assessing the immediate impact on rep workloads.

Salesforce CRM Sync
The Spreadsheet: Manual CSV exports and imports corrupt historical account assignments and leave CRM data out of sync.
The eSpatial Method: Approved territory changes write directly back into Salesforce CRM standard or custom territory objects via bi-directional synchronization, preserving data integrity automatically.
The Human Element: Combining Tech with "Feet on the Ground"
No algorithm understands the nuances of human relationships. A software engine will never know that a rep is in the middle of a delicate $2M renewal negotiation, or that a mountain pass makes traveling between adjacent zip codes impossible during winter.
Technology alone is not the answer; combining automated spatial workflows with human oversight is the key to execution. When you run live, interactive mapping sessions, sales managers and reps bring the critical "feet on the ground" context that no database holds.
Exploring scenarios collaboratively on a live visual map incorporates that local knowledge in real time. Sales reps see that territory shifts are mathematically fair, commission opportunities are protected, and travel drag is reduced. Stakeholders across HR, Operations, Marketing, and Sales Leadership align on a single visual source of truth—eliminating political friction and turning fear of disruption into predictable revenue execution.
The Sales Ops Selection Checklist
|
Evaluation Area |
Do |
Don't |
|---|---|---|
|
CRM Integration |
Mandate direct, bi-directional synchronization strictly with Salesforce CRM so realignments write back to territory objects automatically. |
Settle for static CSV exports or one-way data pushes that leave account data out of sync. |
|
Travel Calculation |
Require true Isochrone drive-time and distance routing based on actual road networks and traffic patterns. |
Rely on straight-line "as-the-crow-flies" radial buffers that miscalculate travel reality and field capacity. |
|
Stakeholder Alignment |
Demand live, interactive scenario testing ("what-if" modeling) to adjust boundaries and calculate Workload Index shifts live during meetings. |
Rely on static slide decks or PDF exports that require days of manual revisions between iterations. |
|
Implementation & Support |
Select solutions with human-first onboarding and rapid support response times from dedicated mapping specialists. |
Accept multi-week support lags or rigid, complex GIS tools that require dedicated technical specialists. |
|
Data Visualization |
Layer multiple data sets simultaneously (e.g., active pipeline, machine density, competitor locations, rep home bases). |
Limit analysis to single-variable pin maps that hide complex market overlaps and whitespace potential. |
Ready to Visualize Your Data on a Map?
Spreadsheets and static dashboards tell you what is happening in your sales pipeline, but they are blind to where those opportunities exist. For Sales Operations leaders tasked with maximizing revenue while eliminating internal political friction, location intelligence provides the essential visual layer.
By combining automated spatial intelligence with collaborative human insight, you build bulletproof territories, optimize field travel, and turn complex strategic planning into predictable execution.
Other Guides
-
Marketer's Guide to Winning With Mapping Software
Eliminate data blind spots, drive regional campaign ROI, and turn geographic insights into a strategic advantage for your entire marketing organization.
-
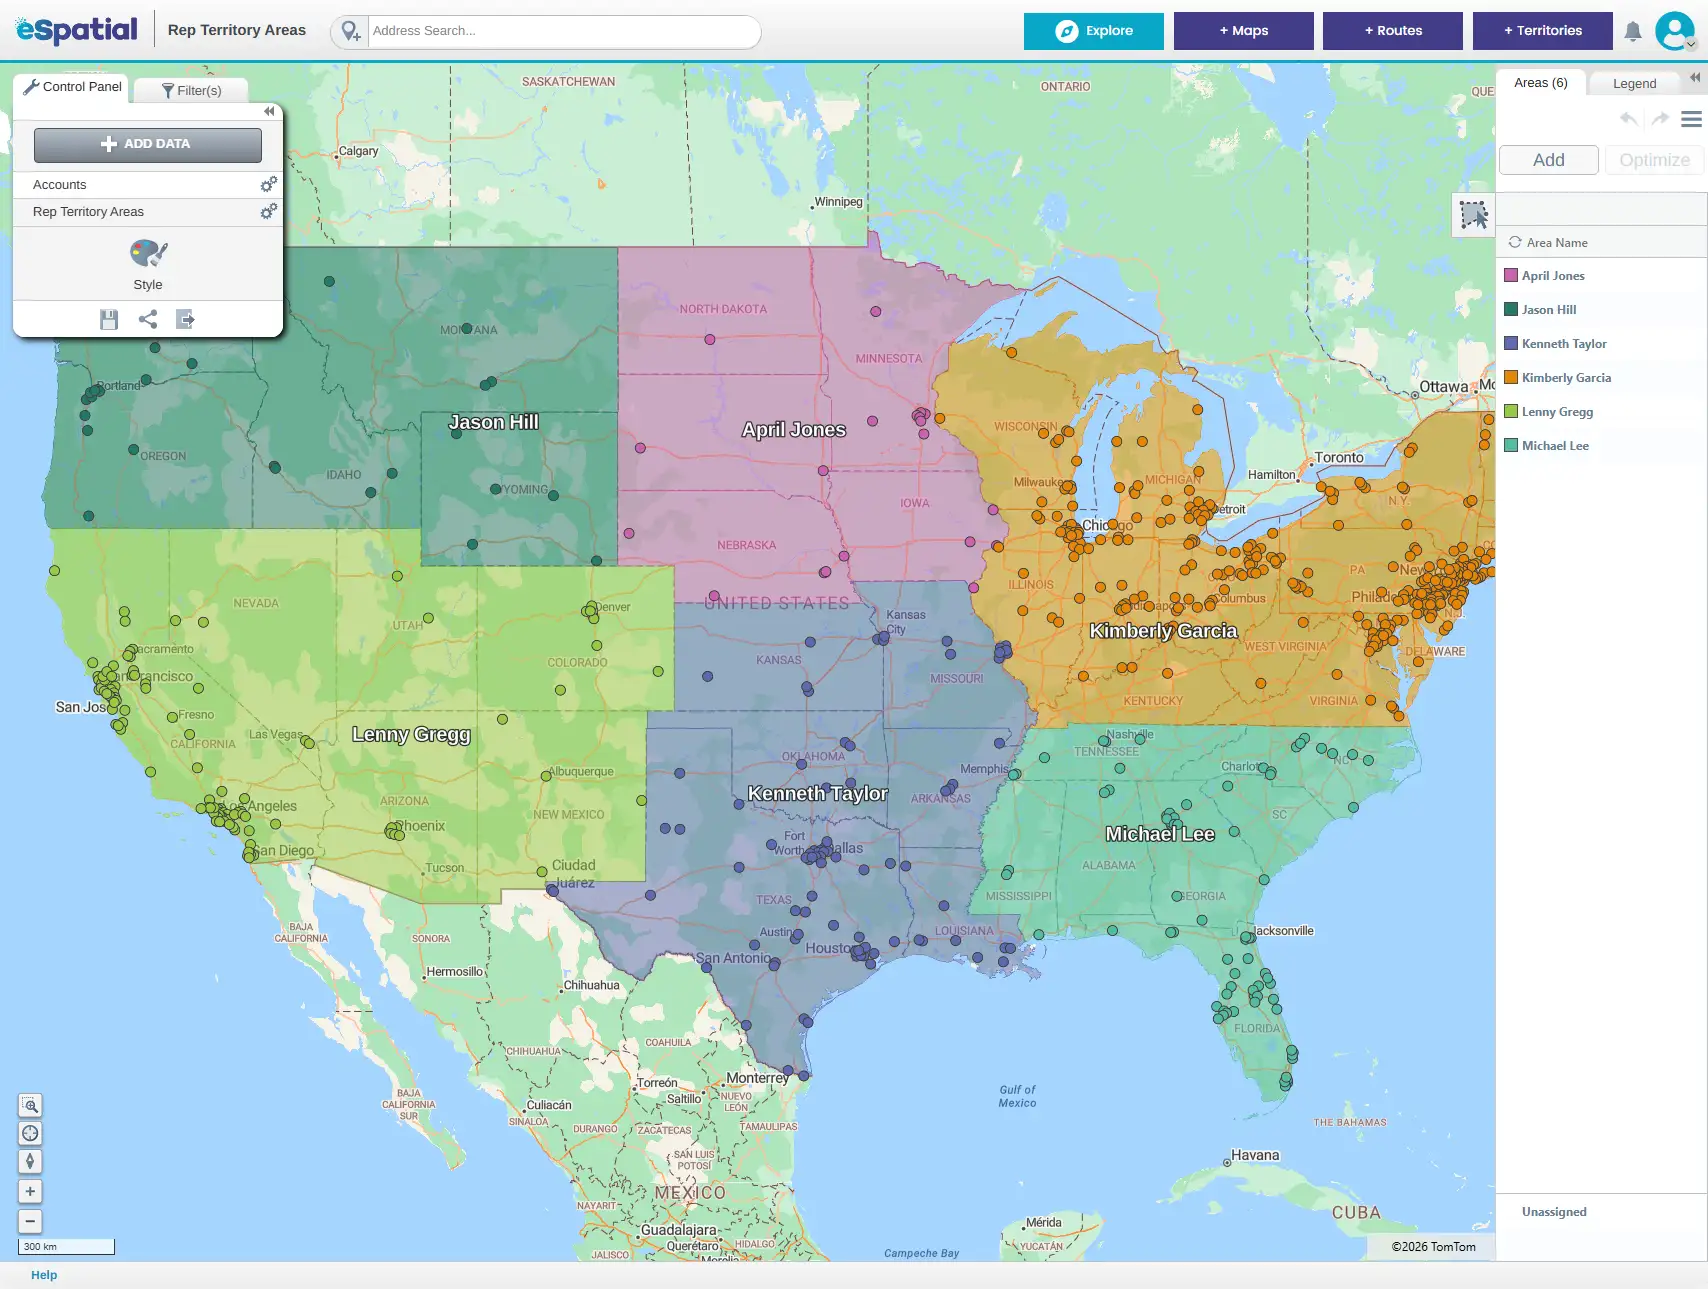
The Sales Leader’s Guide to Mapping Software
Eliminate territory blind spots, optimize field productivity, and drive data-backed growth across your entire organization.
-

The IT & Data Analyst's Guide
to Winning with MapsBridge the gap between raw data and business impact with secure, scalable location intelligence.
-

The Talent Manager’s Guide
to Winning with MapsEliminate recruitment blind spots, optimize workforce distribution, and drive data-backed human capital growth.