Introduction
You've been there. Staring at an endless spreadsheet of employee data, applicant locations, and competitor office addresses, trying to connect the dots and answer a simple but critical question from the C-suite:
- Where should we hire next?
- What skills are we missing?
It's a task that feels less like strategy and more like a frustrating, manual puzzle. You know the data holds the answers, but it's siloed in your HRIS, ATS, and a dozen different Excel files. You're asked to be a strategic leader, but you're stuck doing tactical data entry. What if you could transform that data from a static list into a dynamic, visual map? What if you could see, at a glance, where your top talent is concentrated, where skill gaps exist, and which markets are ripe for expansion?
This guide isn't about theoretical best practices. It's about bridging the gap between strategic vision and your daily reality. We'll show you how to leverage mapping software to make confident, data-backed decisions—the kind that get buy-in from leadership and truly move the needle for your organization. This is about giving you the most pragmatic, effective way to turn your messy data into a strategic advantage, even if you don't have time for perfection.
-
1. New reality
Why you need to look beyond the spreadsheet
View chapter about "1. New reality" -
2. Core concepts
How to get from data to decision
View chapter about "2. Core concepts" -
3. Scenarios
The benefits of mapping software
View chapter about "3. Scenarios" -
4. What to look for
How mapping software can be used
View chapter about "4. What to look for"
Chapter 1
The New Reality for Talent Leaders Why You Need to Look Beyond the Spreadsheet

1. What is Mapping Software for Talent Managers?
For you, mapping software is a powerful visualization tool. It's the ability to take all your workforce-related data, employee addresses, candidate locations, demographic statistics, and plot it on an interactive map. This goes beyond a simple pin-drop; it's about transforming complex, text-based data into clear, actionable visuals like heatmaps, bubble maps, and color-coded maps. This is the key to seeing patterns and relationships in your data that a spreadsheet could never reveal.

2. Why is It so Important for Your Business?
Your ability to find the right talent in the right location is the single greatest competitive advantage you can build. Without a clear visual view of where talent exists, you're flying blind. You might be missing out on a large talent pool in an underserved market or over-hiring in a city that's already saturated. A strategic approach to workforce planning ensures you're not just filling roles; you're building a foundation for growth. It's how you make sure your workforce can scale effectively, support your business's expansion plans, and ensure you’re not caught off guard by changing market dynamics.

3. Old Way Versus the New Way
The old way is manual, frustrating, and prone to error. It’s using Excel spreadsheets to manually cross-reference candidate ZIP codes with company locations and demographic data. It's the dreaded pivot table that takes a full afternoon to build and is outdated the moment you hit "save" The old way is a patchwork of disconnected data sources that gives you snapshots, but no real-time insights.
The new way is visual, intuitive, and collaborative. It's taking all your data, from your ATS, HRIS, and other sources, and instantly visualizing it on a map. This new way allows you to see the big picture without the heavy lift. You can quickly answer questions like:
- Which cities have a high concentration of qualified candidates for a new role?
- Are we attracting enough talent from key competitor markets?
- Where are our skill gaps geographically, and how can we proactively address them?
The new way is less about data manipulation and more about strategic decision-making.

4. Who Uses Mapping Software?
While mapping software is often used by sales and marketing, you'll find it's a game-changer for talent leaders, too. HR executives, talent acquisition managers, and workforce planners are using it to:
- Analyze Market Opportunities: Identify new locations to expand talent search efforts or even open a new office
- Improve Recruitment Strategy: Visualize where job applicants are located versus where your existing employees and key competitors are
- Communicate with Leadership: Present complex workforce data in a simple, compelling visual format that gets immediate buy-in
- Enhance Retention: Visualize employee commute times and potential relocation needs to inform talent retention strategies
Mapping software is the bridge between your data and your strategic goals. It’s the tool that allows you to confidently make decisions and communicate them to the C-suite.
How It Works
Step 1
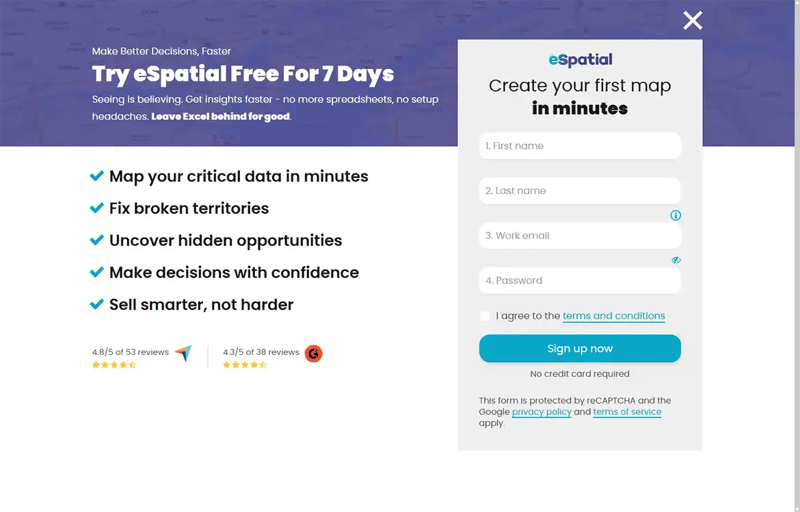
Sign up & Upload
Your Data
Create a free account on our website, no credit card required. Then, upload your data from spreadsheets, CRMs, or other sources. eSpatial supports multiple file types, so you can get started quickly with minimal prep.
Step 2
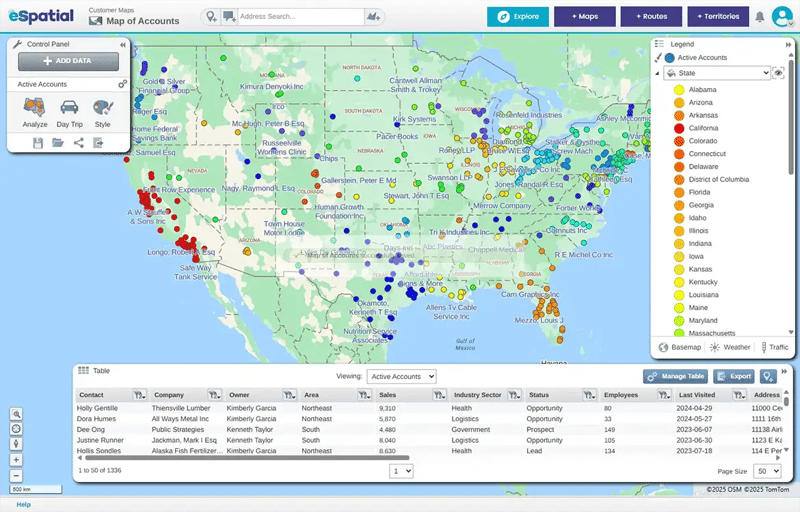
Map And
Customize
Plot your data points like stores, clients, or assets on an interactive map. Use built-in filters, labels, and styling tools to highlight trends, customize views, and layer in details like sales territories or customer segments.
Step 3
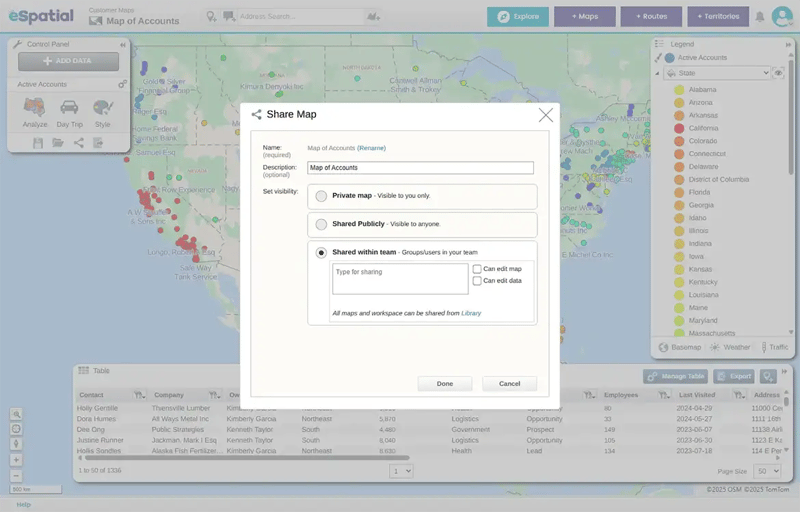
Analyze And
Share Insights
Leverage powerful analytics to create heat maps, territory plans, or optimized routes. Easily share your visual insights through exportable formats or interactive maps to accelerate decision-making across your team.
Chapter 2
The Core Concepts of Mapping Software From Data to Decision

1. Getting Started With Your Data
The first step is always the hardest: getting your data in one place. Don’t let this stop you. You likely have most of the data you need already. The beauty of modern mapping software is that it can work with what you have, even if it's just a simple spreadsheet.
Start with the basics. You need a list of locations. These could be:
- Your employees' ZIP codes or home addresses.
- Job applicant locations from your ATS.
- The locations of your offices.
- Your field team locations.
Just upload your CSV or Excel file. The software does the heavy lifting, automatically placing your data points on a map. This is the first, most powerful step in turning your data into a strategic asset.

2. Power of Visual Data: Pin Maps, Heatmaps, and More
The real magic of mapping software lies in its ability to transform raw data into powerful visuals. Forget static pin maps; today's tools offer dynamic visualizations that provide instant insights:
- Pin Maps: A basic but essential tool. A pin map simply shows the exact location of each data point, such as every applicant in a given city.
- Heatmaps: These are your secret weapon. A heatmap uses color to show the density of your data points. You can instantly see where your most qualified candidates are concentrated or where a specific skill set is most prevalent.
- Color-Coded Maps: You can shade an entire geographic area, like a ZIP code or a state, based on a specific data metric. For example, you could shade ZIP codes by the number of applicants you've received from that area or by the average salary of a specific role.
- Bubble Maps: This is a great way to visualize two data points at once. Each bubble on the map can represent a city, with the size of the bubble indicating the number of applicants and the color indicating the average years of experience, for example.

3. What Are the Benefits of Using Mapping Software?
The benefits are real and immediate, even if you’re just starting out:
- Go from data to decision 95% faster
Stop wrestling with complex spreadsheets. Upload your data and see it all on an interactive map in minutes, this cuts analysis and planning time by up to 95%, freeing you up for more strategic work - Drive better business outcomes
By visualizing your data, you can uncover hidden growth opportunities and make decisions that increase revenue by up to 12% by ensuring you have the right talent in the right place to support business growth - Get buy-in from leadership
You can stop presenting numbers and start telling a visual story. An interactive map is far more compelling than a chart, you can easily show where talent hotspots exist and where your company needs to invest to align with market trends
Chapter 3
Real-world Scenarios For the Talent Finder

1. Market Analysis & Opportunity Identification
The problem: Your executive team wants to know where the next big talent pool is for a new role. They've suggested a few cities, but you need data to back up a recommendation.
The solution: You can use mapping software to layer several types of data onto a single map:
- Candidate fata: Upload a CSV of applicant addresses from your ATS and visualize them as pin maps or heatmaps to see where candidates are concentrated
- Competitor locations: Plot the addresses of key competitor offices
- Demographic data: Pull in census data or third-party data on age, education level, and relevant industries. Visualize this using color-coded maps to identify areas that match your ideal candidate profile
The result is a powerful visual that shows you where talent is located, where your competitors are, and where there are untapped markets. This provides a clear, data-backed answer to the C-suite's question.

2. Strategic Workforce Alignment
The problem: You have a new remote-first strategy, but you need to ensure you have an equitable distribution of employees across the country to support customer needs.
The solution: You can map your current employees' locations using a pin map. You can then overlay a bubble map of your key clients, with the size of the bubbles representing the number of clients in that area. This allows you to see if you have any geographical blind spots. For instance, you might see that you have a large number of employees on the East Coast, but a significant gap in the Midwest, which is where many of your clients are. This visual insight can then inform your future hiring strategy, allowing you to focus recruitment efforts on areas that will balance your workforce and better serve your customers.

3. Visualizing Data for Leadership & Stakeholders
The problem: You've spent weeks compiling a report on talent gaps, but when you present it, your stakeholders are overwhelmed by the numbers and charts.
The solution: Stop using static reports. Instead, use an interactive map. When you show leadership a color-coded map that clearly visualizes your top talent's locations, the number of applicants you've received in specific regions, and where your competitors are based, it transforms a complex issue into an easy-to-understand strategic conversation. It's a shared language that ensures everyone is working from the same trusted information.
Chapter 4
What to Look for in a Mapping Software

1. Getting Your Data Onto the Map
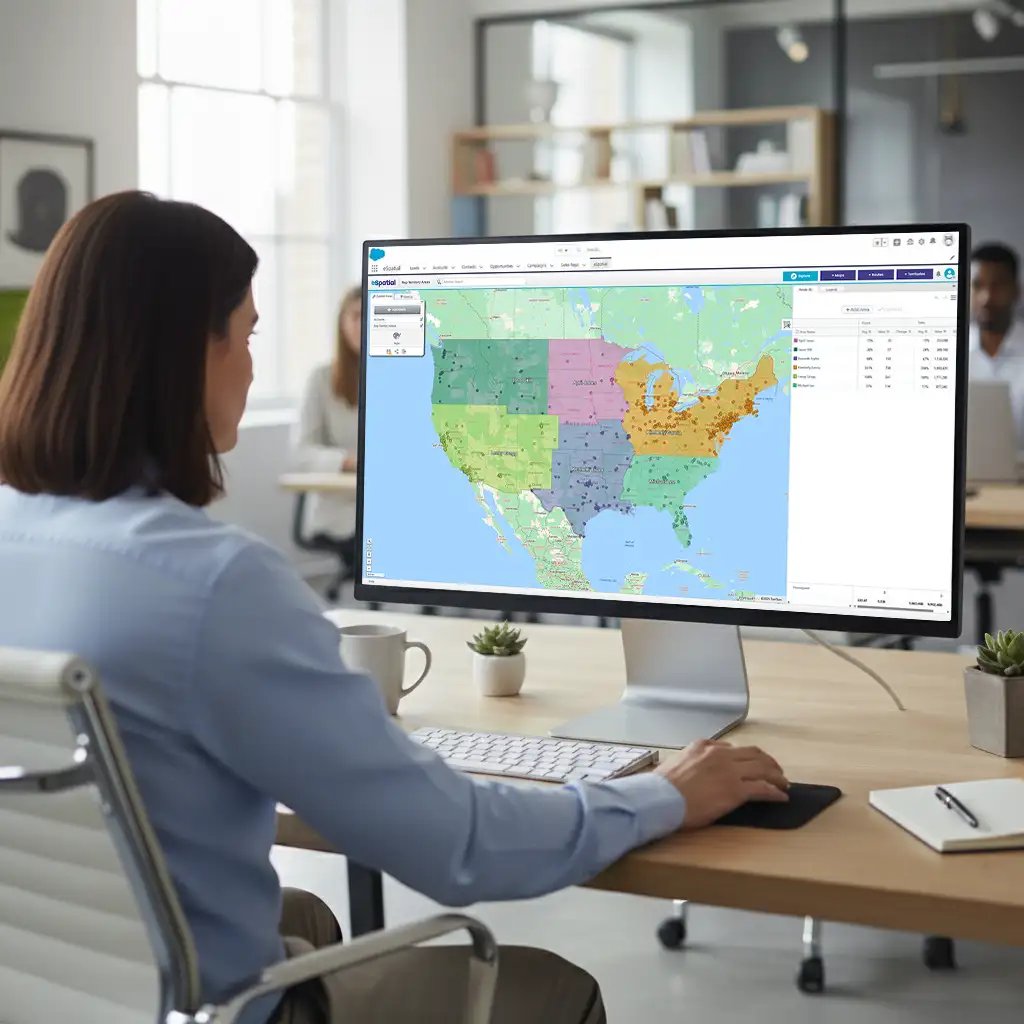
The first thing to look for is simplicity. The best software will make it incredibly easy to upload your data. It should accept common file formats like CSV and Excel. Look for a solution that can handle your data volume and automatically geocode your addresses (convert addresses to map coordinates).
2. Ability to Create Data Visualizations
The software should allow you to create and edit pin maps, heatmaps, bubble maps, and color-coded maps in a simple, intuitive way. You should be able to segment your data based on any field (e.g., job title, skill set, years of experience) and see the visual results instantly. This is the core functionality you need to segment your data effectively.

3. Ability to Display Multiple Data Layers
Your workforce strategy is complex. Your mapping software shouldn't be. Look for a solution that allows you to easily overlay multiple data sets on a single map. You should be able to view your employee locations, open job requisitions, and competitor headquarters all at the same time. This is how you gain a holistic, strategic view of your workforce.
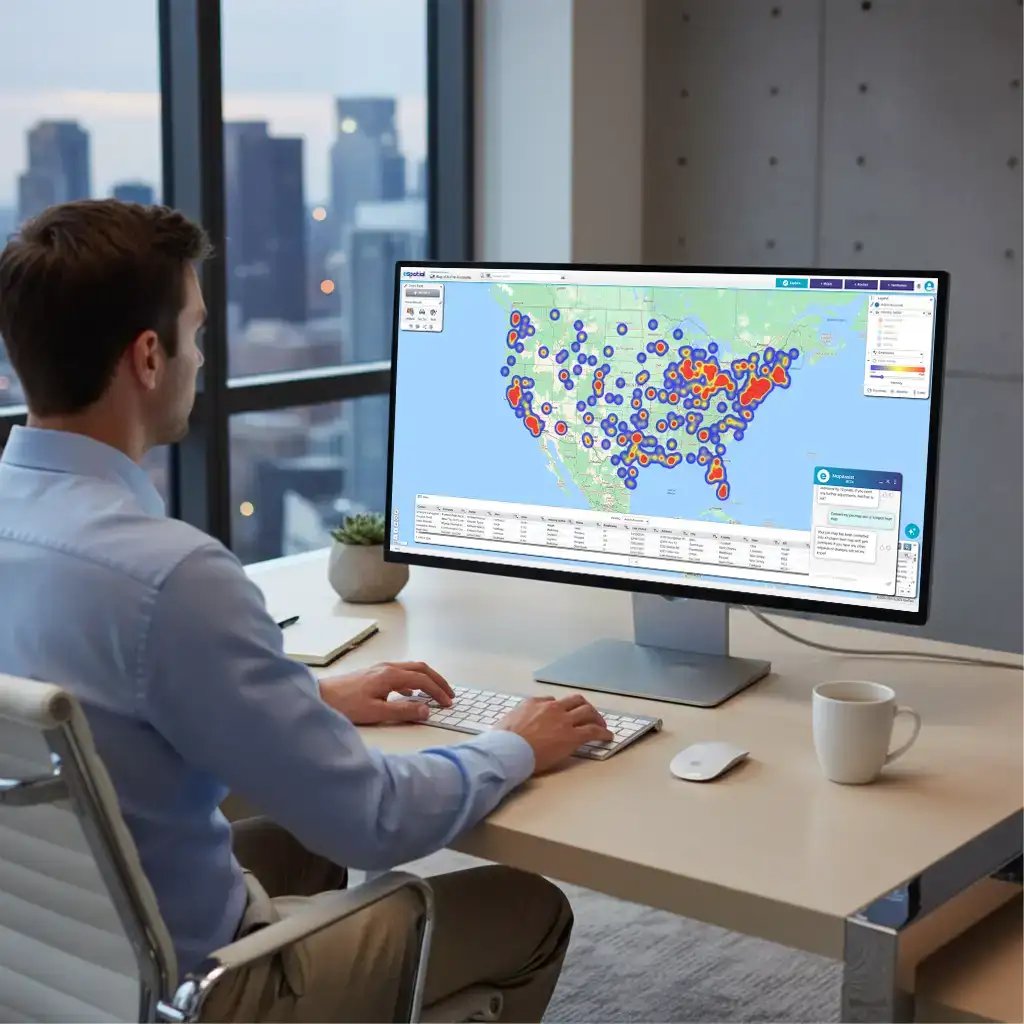
4. AI Embedded in the Mapping Software
With AI, you can accomplish everything faster and more reliably. eSpatial now as an AI assistant embedded in the tool so you get more done in less time.
Frequently Asked Questions
Key questions to ask a mapping software vendor
How Much Does It Cost?
Make sure you understand the pricing model. Are there different tiers based on user count or features? Are there any hidden fees for data uploads or advanced features? A good vendor will be transparent about their pricing.
How is Training and Support Provided?
You don’t have time to become a mapping expert. You need a solution that is easy to use and a vendor who provides excellent support. Ask about training resources, customer support channels (phone, email, chat), and how quickly you can expect a response.
How is the Software Deployed?
Modern, cloud-based software is the most flexible and scalable option. With a web-based solution, you can access your maps from anywhere, on any device. This is crucial for collaborating with remote teams and presenting to executives on the go.
What Security and Data Protection Do You Have in Place?
As a talent leader, you are responsible for sensitive employee and applicant data. You must ensure the software is secure. Ask about their security protocols, data encryption, and any third-party security audits they have undergone.
What About Data Geocoding or Data Limits - Will They Meet Your Needs?
Geocoding is the process of converting addresses into map coordinates. Ask if the software has unlimited geocoding. Additionally, ask if there are any limits on the amount of data you can upload. You need a solution that can scale with your organization as your workforce data grows.
Other Items to Assess
-
Performance
How quickly does the map refresh? Can it handle large data volumes without slowing down?
-
Scalability
Can the system scale with your needs as your company grows?
-
Future-proofing
How often does the vendor release new features? Are they automatically available? Are they keeping up to date with new technologies?
-
API
Can the system integrate with your existing HRIS or ATS? An API allows for seamless data flow, reducing manual work.
-
Mobility
Can you access your maps from any device, including a phone or tablet?
-
Single Sign On (SSO)
Does the software support SSO for a secure and seamless login process?
Conclusion
For too long, workforce planning has been a frustrating, numbers-driven exercise. But it doesn't have to be. By moving beyond the spreadsheet and embracing mapping software, you can transform your role from a tactical data wrangler to a strategic leader. This is the most pragmatic, effective way to turn your data into a visual story that gets buy-in from leadership, attracts top talent, and prepares your organization for the future.
