• Data visualization

How to Avoid the Limitations of Creating Maps in Excel

Liam Costello
  • Published: March 19, 2021
  • Updated: November 21, 2025
  • Author: Liam Costello
  • Reading time: 8 mins
Territory map, USA

Quick answer

Excel's built-in map charts handle simple visualizations but often crumble under the weight of detailed, real-world data. Accuracy is everything. Excel frequently struggles with ZIP code granularity and customization, risking the reliability of your strategic decisions.

What we cover

  • The basics: How to launch Excel's "Filled Map" for quick, simple charts
  • The trap: Why ZIP code plotting in Excel is notoriously unreliable
  • The limits: Where the tool fails on detail, customization, and sharing
  • The upgrade: Moving to eSpatial for dynamic heat maps that actually drive business action

Excel Maps Hit a Wall


The reality: Excel is built for spreadsheets, not maps. Its native charts lack the power needed for serious sales territory mapping.

You cannot analyse complex geographic data with basic tools. You need a dedicated engine like eSpatial. We break down Excel’s mapping limitations and show how eSpatial’s heat mapping unlocks your data’s full potential.

Can You Create a Map in Excel?


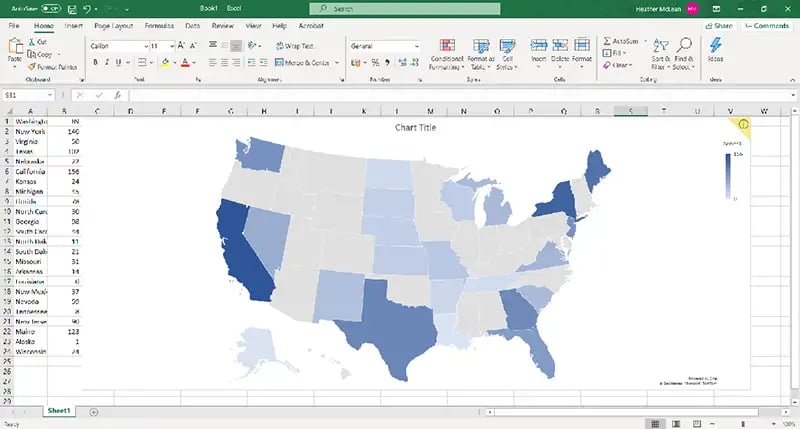
You can generate a "map chart," directly inside Excel, but it serves as a basic visualisation tool, not a comprehensive mapping engine.

How to do it: Select your data, one column for geography, one for metrics, and navigate to Insert > Maps > Filled Maps.

The catch: Excel struggles with granularity. It falters when you need deep customisation, multi-layered insights, or clear analysis of localised data.

Excel heat map

How to Create a Map Chart in Excel


Creating a basic map in Excel is straightforward if your data is structured just right. Below is a step-by-step guide.

Step 1

Prepare Your Data

Your data must include labels, such as countries, states, counties, or ZIP codes, and a numeric value for each.

Example layout:

State

Sales

California

250,000

Texas

180,000

New York

195,000

To create a ZIP code map chart in Excel, ZIPs must be stored as text, not numbers; otherwise, Excel may drop leading zeros or misinterpret the data.

Step 2

Select the Data and Insert a Map Chart

Highlight your data table. Then:

  1. Click the "Insert" tab on the Excel ribbon
  2. Select the "Maps" icon in the Charts group
  3. Choose "Filled Map"

Excel will render a map chart.

Step 3

Customize the Appearance

Once the map appears, you can adjust:

  • Color scale
  • Chart title and legend
  • Data labels (values, category names, or both)

Great for basic visuals you cannot apply filters, layers, or interactive features. or convert Excel data to map views by time, team, or product.

Step 4

Interpret With Caution

Excel’s mapping engine doesn’t always recognize all ZIPs, especially P.O. boxes or newly assigned codes. The platform isn’t designed for complex spatial analysis.

Excel Map Charts the Dealbreakers


Excel offers quick visuals, but its lack of depth and accuracy creates serious risks for strategic territory planning.

Decision-makers need precision. Excel’s limitations force you to spend more time troubleshooting errors than analyzing opportunities.

The 6 key failures:

  1. Coverage gaps: Fails on detailed administrative boundaries and specific postcodes
  2. Static images: You cannot filter, drill down, or interact with live data
  3. Rigid styling: Restricted to presets. You cannot add layers, annotations, or context
  4. Data errors: Frequently misinterprets place names or ignores rows it does not recognise
  5. No motion: Lacks animation, time-series mapping, or multi-dataset integration
  6. Scale failure: Large datasets (coverage, density) cause the tool to slow down or crash

Excel is for basic charts. For precision, customization, and clarity, you need a dedicated engine like eSpatial.

Better Alternatives: Create Heat
Maps and More With eSpatial


If you have outgrown Excel’s rigid charts, switch to a platform purpose-built for location intelligence.

You need power, not workarounds. eSpatial eliminates formatting frustration and geographic guesswork, letting you visualize data instantly.

With eSpatial, you can:

  • Build heatmaps in minutes

  • Collaborate and share

  • Map thousands of rows and ZIP codes instantly without crashes or lag.

  • Style and layer datasets

Regional heat map of Los Angeles
Bring your data to life with eSpatial

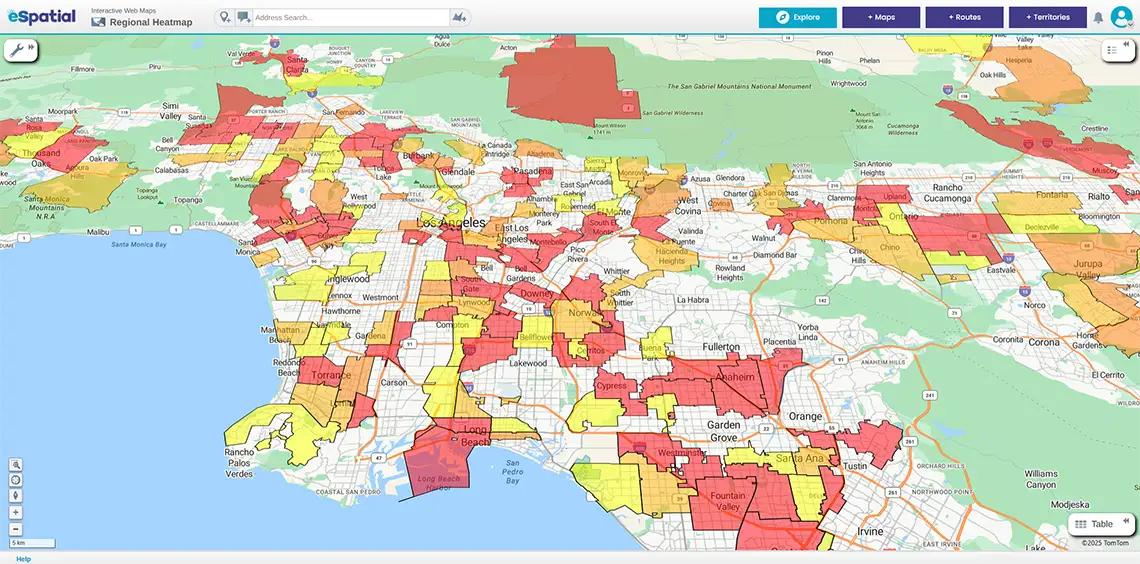
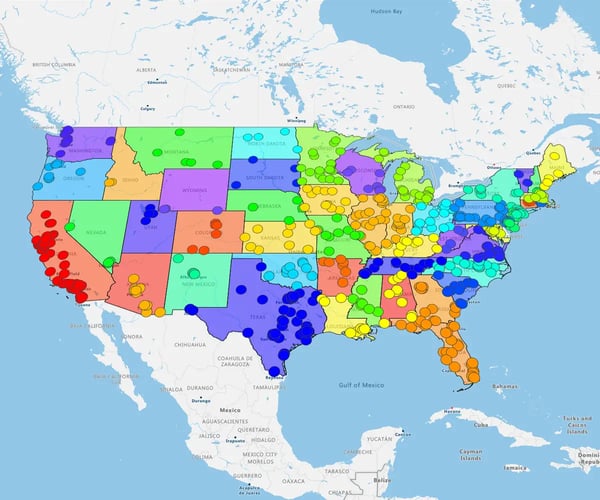
Make geographic analysis intuitive. Map ZIP codes, analyze sales territories, and uncover customer trends instantly. eSpatial geo mapping software gives you the clarity Excel can't.

Want to Learn More About Mapping in eSpatial?

Our team is here to help you get the most from your location data. If you're moving beyond creating maps in Excel and want a faster, simpler way to visualize insights, we’re ready to support you.

Book a free demo today and discover how eSpatial can help your business make better decisions, faster, no matter how complex your mapping needs.

You appear to be offline at the moment, this notice will disappear once your device can connect to the internet again