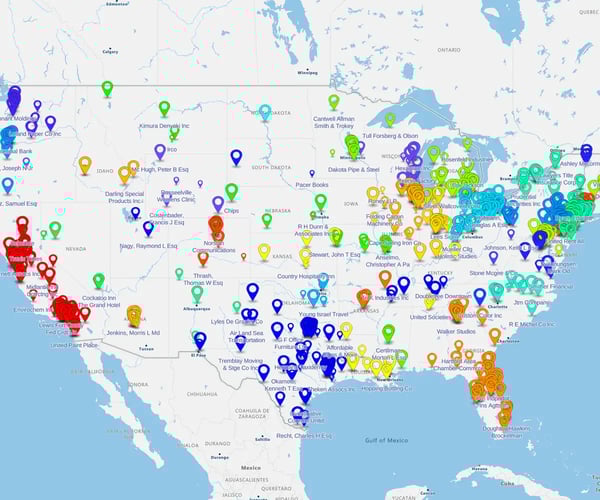
• Data visualization

What is Spatial Mapping: Visualizing Data and Gaining Actionable Insights

Liam Costello
  • Published: May 27, 2024
  • Updated: September 19, 2025
  • Author: Liam Costello
  • Reading time: 10 mins

Quick answer

Spatial mapping is a powerful technology that uses geospatial data to visualize geographic distributions, offering a more scalable and insightful alternative to traditional maps.

Key takeaways on spatial mapping:

  • It is used to create digital visualizations of maps that represent geographical data
  • Spatial mapping has applications across various industries, including healthcare, finance, real estate, and logistics
  • It helps businesses with tasks like route optimization, fraud detection, market analysis, and site selection
  • The process for creating a spatial map involves defining objectives, choosing software, preparing data, and analyzing the results
  • Technology, such as eSpatial's customizable software, is key for gaining actionable insights and improving operations

Maps have been used since ancient civilizations to help navigate and understand the world. Paper and parchment have advanced to digital maps capable of interacting with geospatial data and visualization, known as spatial mapping. So, what is spatial mapping, and how is it used today?

Simply put, spatial mapping captures and displays geospatial data on different industries' maps to visualize business operations, customers, locations, and assets. In this guide, you will learn more about geospatial data mapping, how it works, and some of the industries where it’s bringing revolutionary change. You’ll also learn the easy steps required to create a geospatial map so you can visualize and analyze data. Let’s dive in.

What is spatial mapping?

Spatial mapping is the digital construction and visualization of maps representing geographical distributions and connections from raw geospatial datasets. In other words, spatial mapping is the visual representation of geographical information on maps. It involves collecting raw geospatial data about the locations and characteristics of real-world objects and features through satellite imagery, GPS, or surveys and then relies on geo-mapping as a visual aid. So, what is geo-mapping exactly?

Geomapping refers to the process of assigning geographic identifiers to spatial datasets and displaying them on digital map platforms for visualization. By making maps of the real world, spatial maps create virtual worlds that resemble real roads and points of interest in a geographic space.

Geospatial mapping explains how the GPS on your phone or vehicle works to help you navigate or how engineers know the right place to construct a bridge. Before spatial mapping, people used traditional paper-based maps to represent geographic information.

Technological advancements make spatial map representations far more powerful, dynamic, and scalable than static paper map representations. As you’ll discover further in this article, geospatial mapping is indispensable as it solves complex issues related to mobility, infrastructure, the environment, and community services.

Use cases for spatial mapping

Spatial mapping's ability to digitally capture and visualize environments and determine precise locations within mapped spaces makes it essential in many industries. But what is geospatial mapping used for the most? It’s an exciting technology that has driven advances like autonomous vehicles, enabling archeological preservations, complex surgeries, and other transformative applications. Here are some industries that are being revolutionized by spatial mapping.

EKG machine with surgeons in the background

Healthcare

What is a spatial map used for in the healthcare industry? In healthcare institutions, spatial mapping allows providers to visualize patient data, demographics, and other clinical data on interactive maps. At eSpatial, our clinical mapping software allows healthcare providers to layer different datasets on the maps to help them compare patterns and trends and serve patients better.

3 people reviewing code on a computer

Tech and Software

Spatial context and location analytics are useful in the infrastructure, sales, and product development for tech and software. Tech businesses that use mapping software optimize their operations and offer better customer support. Mapping customer locations and technician territories improves field operations, allocates resources, and prioritizes jobs.

Tech and software companies can use our territory, routing, and mapping software to plan and optimize routes for field-based staff, such as sales reps. The maps also help maximize time with customers and reduce costs.

People looking over a tablet with graphs and charts

Financial Services

Successful financial institutions understand customer needs and mitigate risks. Spatial mapping enables data-driven insights, while spatial analytics provide location intelligence. Visualizing asset locations and risks also helps with loan portfolio management and real estate lending.

Bank managers use maps to optimize client territories and uncover more business opportunities. With maps, financial institutions suffer fewer risks as they help in fraud detection, economic impact analysis, and regulatory reporting compliance. Transform your financial data into interactive maps and understand customer behavior and risk factors through our eSpatial market analysis mapping software for financial services.

Map with property image label

Real Estate

Real estate professionals rely on spatial maps for accurate insights into real estate markets. Experts can uncover trends and competitive insights about property markets and assets by integrating specific datasets into maps.

The real estate sector uses location intelligence to use maps for site selection, market analysis, property valuation, sales, and leasing. Let our eSpatial mapping software for real estate organizations help you with property searches, visual representation, and market analysis to give you a competitive edge.

Warehouse full of brown packing boxes

Supply Chain Logistics

Manufacturers need fresh insights to make strategic decisions in a highly volatile business environment like today’s, where many businesses face the threat of going bankrupt. Spatial mapping can help supply chains gain locational visibility and insights to better understand demand patterns and customer behaviors.

Spatial tools also help with warehouse optimization, routing, and demand forecasting. Optimizing warehouse and distribution locations and delivery routes reduces transportation and logistics costs. Inventory and transportation management rely on maps to identify location issues and bottlenecks. With mapping software for manufacturers, you can gain 360-degree visibility into potential risks and improve your supply chain logistics.

Cement mixing truck

Construction

Spatial mapping is instrumental in construction when it comes to planning, site analysis, and risk management. Mapping tools allow analysis of topography, geology, soil composition, and other factors to assess site suitability.

Mapping software in the construction industry helps design infrastructure networks and better project management through geographic context. Construction engineers also use maps to analyze soil, groundwater, and potential disasters.

How to Create a Geospatial Map


A complete geo-mapping definition should cover the mapping, visualization, and analysis of data on digital platforms. However, there’s no singular way to create geospatial maps, as the process differs depending on objectives, purpose, and data sources. It’s important to note that the quality of the insights obtained from geospatial analysis relies on the quality of your input data.

Step 1

Define Your Objective

You must first define your objectives to focus on why you need the mapping project. Define the questions the map will answer, its audience and their needs, the required data layers, optimal display techniques, desired conclusions, and metrics for success. These objectives will help in setting priorities.

Step 2

Choose a Mapping Software

When choosing mapping software, you need to consider a few factors. First, ensure the software can create the necessary map types, such as heat maps, buffer maps, and routing maps. Different kinds of maps allow you to visualize and understand your geospatial data best.

Next, check compatibility with important data sources and formats to facilitate the import of location data. You may also need to check reviews and client testimonials. Select a vendor committed to ongoing innovation to futureproof your investment and needs.

Step 3

Collect and Prepare Data

Collecting and structuring quality data correctly lays the foundation for insightful geospatial analysis and visualization. Identify relevant datasets such as location coordinates, addresses, and other information.

Next, compile the data from various sources, such as spreadsheets, databases, or existing GIS files. Then, assess the data to ensure it’s complete, accurate, and uniform. You'll then need to structure the files with unique identifiers and standardized address and location fields to geocode them onto the map.

Step 4

Set up Your Parameters

Parameters are important for your maps as they ensure correct data display without distortion and maintain the accuracy of the spatial analysis. Setting up key parameters ensures your map displays and analyzes data properly based on your objectives. Choose an appropriate base map that provides spatial context for your region of interest.

Step 5

Analyze the Results

Analyzing the final results is exciting as it helps verify if the maps achieved the intended purpose and objectives. Visually review the final map, use analysis tools to extract quantitative insights, and compare different datasets overlapped on the map. Note any unusual hotspots requiring investigation and export results for validation and documentation.

Mapping solutions for businesses from eSpatial

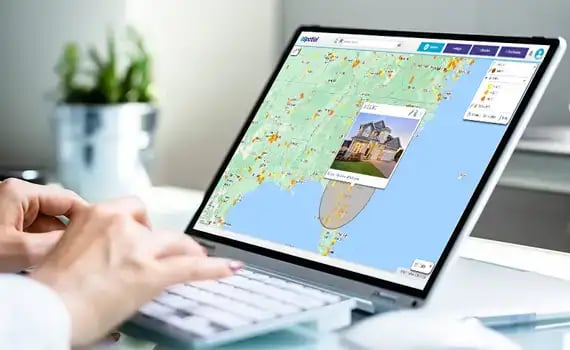
Are you seeking advanced spatial analytics tools to help your business glean deep insights from location data through heat mapping and routing? Our eSpatial mapping software helps visualize your Excel, CRM, or ERP data for better business decisions through actionable insights.

Getting clear insights from data is an extremely reliable way to improve business operations, which is why every business that pulls data from varied sources could benefit from spatial mapping to improve operations, predict trends, serve customers better, and reduce risks, among other advantages.

Healthcare, construction, real estate, manufacturing, tech, and software are just some of the industries that benefit from mapping solutions. Don’t let your data go unutilized. Learn how our customizable mapping software solutions can support your unique needs, from scalable data management to customizable analytics dashboards. Contact us today to start optimizing your business with spatial mapping.

Frequently Asked Questions


My Team Spends Hours in Spreadsheets Trying to Analyze Location Data, but We're Not Getting Clear Insights. How is Using Spatial Mapping Fundamentally Different From the Pivot Tables and Charts We're Already Using in Excel?

Spatial mapping is fundamentally different because it transforms spreadsheet data into visual insights on a map, instantly revealing patterns and opportunities that static rows and columns hide.

That's a very common challenge when relying on Excel for planning. While spreadsheets are great for organizing data, they can't answer the crucial "why of where." Spatial mapping turns your numbers into a dynamic, visual layer. Instead of just seeing data points, you see customer clusters, territory gaps, and market trends in seconds. It’s the difference between looking at a list of addresses and seeing exactly where your biggest opportunities are, allowing you to make confident, data-backed decisions instead of educated guesses.

I Use Power Bi, but It’s Hard to Get Real Location Insights; It's More Like Just Putting Dots on a Map. How Does Your Spatial Analysis Provide Deeper Insights That a Standard Bi Tool Can't?

Unlike standard BI tools that just place dots on a map, eSpatial is a dedicated location intelligence platform that provides deeper spatial analysis, like drive-time calculations and white-space analysis.

That's a common challenge, as many BI tools have mapping features but lack analytical depth. eSpatial is built specifically for location intelligence. This means you can go far beyond simple visualization to perform advanced analysis. For example, you can create balanced territories based on drive time, identify "white space" in the market where your competitors are but you aren't, or analyze customer catchments around your locations. It's designed to give you actionable answers to complex location-based questions, not just a prettier picture of your data.

I Need to Plan Our Field Service Routes, but Just Looking at Addresses on a List Doesn't Account for Drive Time or Territory Balance. How Can I Use Spatial Mapping to Create Truly Optimized and Efficient Routes for My Team?

Spatial mapping creates optimized routes by using real-world data like drive times and traffic patterns to balance workloads, ensuring your team has the most efficient and fair plan possible.

You've hit on a key problem with manual planning. A list of accounts doesn't reflect the reality your team faces on the road. With spatial mapping, you can build territories and routes using these real-world factors. You can automatically balance territories not just by the number of accounts, but by the actual workload involved, including travel. This ensures every team member has an equitable and achievable plan, cutting down on wasted fuel and maximizing time spent with customers.

We're Planning a Series of Regional Marketing Events, and I Need to Pick Locations With the Highest Concentration of Customers and Prospects. How Can I Quickly Visualize This Data to Find the Optimal Event Locations Instead of Just Guessing?

You can find the optimal event locations by plotting your customer and prospect data on a map, using tools like heatmaps to instantly visualize geographic hotspots and make a data-backed decision. Guessing is expensive and risky, especially when planning campaigns or events6. Spatial mapping removes that uncertainty. You can instantly plot your customer and prospect data from your CRM or a spreadsheet onto a map. Using tools like heatmaps, you can immediately see the geographic "hotspots" where your target audience is most concentrated7. This allows you to choose event venues with confidence, knowing you've selected a location based on hard data, not just a hunch.

My Company is Expanding Into a New State, and I'm Responsible for the Hiring Plan. How Can Spatial Mapping Help Me Identify Where the Best Talent Pools Are and Analyze Competitor Locations to Make a Strategic Hiring Decision?

Spatial mapping helps you make a strategic hiring decision by visualizing multiple data layers at once—such as talent pools from your ATS, competitor locations, and local demographics—on a single, interactive map.

This is a perfect use case for moving from reactive to proactive workforce planning. Instead of operating with strategic blind spots9, spatial mapping allows you to see the complete talent landscape. You can map candidate data from your Applicant Tracking System (ATS), overlay it with competitor locations, and even integrate third-party data on talent density. This gives you a clear, visual picture, helping you pinpoint the best areas for recruitment and make a compelling, data-driven case for where to focus your hiring efforts.

My Operations and HR Data is Scattered Across Our CRM, an HRIS, and Multiple Spreadsheets. I'm Worried That Getting It All Into a New System Will Be a Massive It Project. How Do You Make It Easy to Integrate and Map Data From Different Sources?

eSpatial makes integration easy by design, offering seamless connections to systems like Salesforce and allowing for simple data uploads from spreadsheets, which minimizes the need for IT involvement.

That fear is completely valid; no one wants a heavy, complex implementation11. eSpatial is designed to be an agile layer that sits on top of your existing systems rather than replacing them. We solve the problem of disconnected data by offering seamless integration with platforms like Salesforce and making it simple to upload data directly from Excel in just a few clicks. The goal is to empower you to blend and visualize data from multiple sources yourself, without creating a dependency on IT for every single analysis.

I'm Concerned My Team Doesn't Have the Technical Skills for a Complex Analytics Tool; They’re Marketers and HR Planners, Not Data Scientists. How Intuitive is Your Platform for Non-technical Users to Actually Adopt and Use for Making Decisions?

Our platform is highly intuitive for non-technical users because it was designed for business teams, featuring a simple visual interface and supported by a full onboarding and success program.

This is a common concern about adopting a new tool. We build for business users, not data scientists. Your team's expertise is in marketing or HR, and our job is to give them a tool that feels intuitive to them. Our platform uses a clear, visual interface that makes complex analysis as simple as a few clicks. More importantly, we partner with you through our onboarding and customer success programs to ensure your team feels confident and gets value from day one. The focus is always on enabling your team to make better decisions, not forcing them to become software experts.

My VP Needs to See the "so What" Behind the Data, but My Charts Don't Always Land. How Does Presenting My Marketing or Workforce Plans on a Map Help Me Tell a More Persuasive Story and Get Faster Buy-in for My Strategic Recommendations?

Presenting your plans on a map helps you get faster buy-in because a map is a universal language; it transforms complex data into a clear, visual story that leadership can understand instantly.

It's a common struggle to present compelling visuals to leadership. A map is a powerful storytelling tool that solves this. Instead of showing a spreadsheet with sales numbers by ZIP code, you can present a heatmap that immediately shows which regions are performing well and which are underserved. This visual clarity shifts the conversation from trying to interpret the data to deciding what to do about it. It helps you present a compelling, undeniable case for your recommendations, leading to faster, more confident buy-in.

Get Started With eSpatial Today

You appear to be offline at the moment, this notice will disappear once your device can connect to the internet again