4.8/5 of 53 reviews
4.3/5 of 38 reviews

What is Geo Mapping Software for Business & Sales Operations?


Turn spreadsheet data into interactive location intelligence. Discover your spatial data story, spot trends, and illuminate business insights.

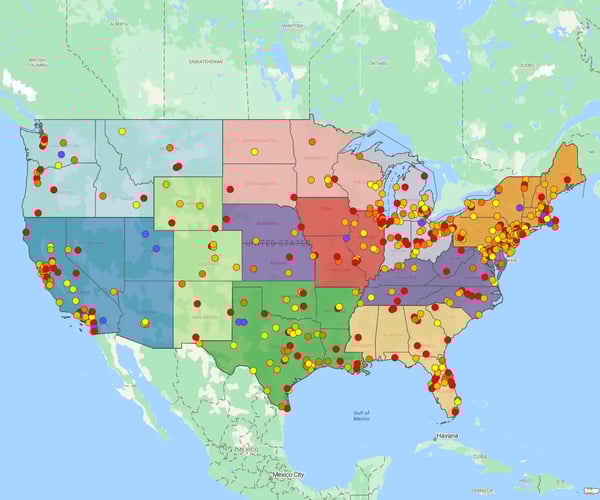
Territory map with pins overlaid What is geo mapping
Video transcript for What is geo mapping

Geo-mapping is a powerful tool for creating maps using location data like sales numbers or demographics. It's a tool lets you easily interpret trends in your data.

For example, I want to filter to just the Chicago area. And I want to narrow my analysis to just those with a higher sales potential than $10,000.

So now I can reveal all of those points. But I want to hide some of the points, the ones below 5, 7, 10 and a half etc.

So only highlight the ones with $15,000 and above. And now I can see the locations and click on a pin to get customer details.

What is geo mapping

Our Customers Love Mapping With eSpatial

  • RE/MAX logo
  • FedEx logo
  • Volvo logo
  • LG Electronics logo
  • Henkel Corporation logo
  • Continental Tire logo

What is Geo Mapping and How Does
It Illuminate Business Strategy?


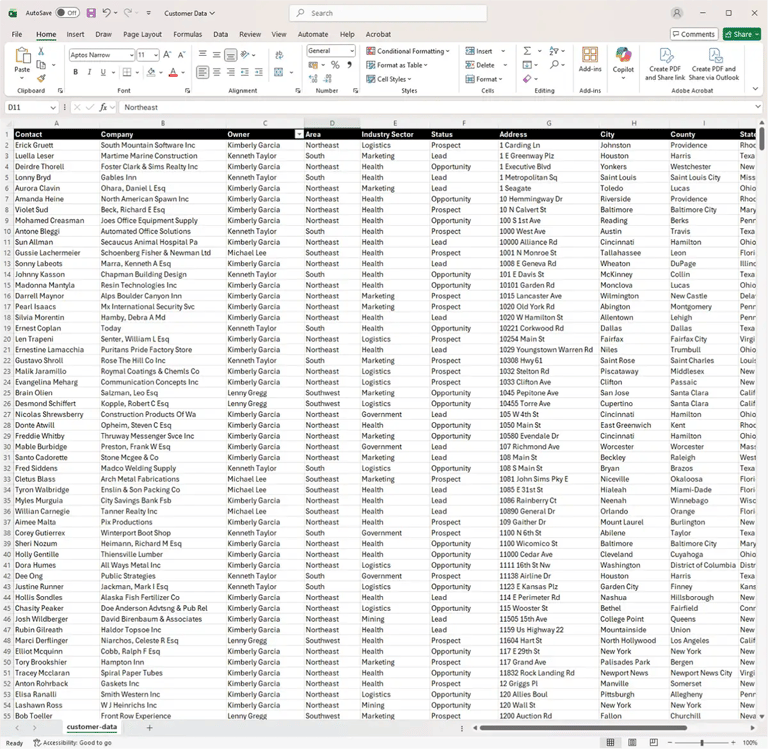
Customer list on a spreadsheet

Geo mapping software is a cloud-based business tool that transforms location-based customer data, such as physical addresses, sales revenue, and postal boundaries, into interactive visual maps. By converting row-and-column reports into clear spatial visualizations, commercial teams immediately uncover revenue trends, regional gaps, and market opportunities.

Deploying field routing tools or redesigning sales boundaries without first visualizing your baseline customer landscape has serious drawbacks. A modern approach using location intelligence begins with visual geo mapping: analyzing regional performance and spotting density patterns to ensure every downstream strategic decision rests on verified market reality. Put simply, spending that time upfront on data visualization and analysis delivers insights that can materially alter your project results. Its insights before execution. And it works.

Pin map highlighting revenue

Strategic insights get lost in the noise spreadsheets generate. Tables show numbers, but maps reveal relationship density, regional clustering, and physical distance. Seeing sales volume color-coded across ZIP codes or account clusters pinned across a territory creates an instant "aha moment" for sales operations and executive leadership alike.

By illuminating your baseline location data first, geo mapping acts as the critical foundation for your broader location intelligence strategy. It clarifies your commercial goals before you invest time into boundary redesigns or daily travel schedules. That will save you hours in future realignment projects and you’ll avoid disruption and pushback from your field teams.

See Your Customer Data On a Map In Under 5 Minutes


Why Start with Visual Mapping
Before Territory Design and Routing?


Visual geo mapping establishes the foundational location intelligence required before committing to complex territory redesigns or daily field routing schedules. Your business data tells a story and it informs your decision making. By visualizing customer locations, regional revenue density, and geographic boundaries first, commercial leaders avoid misallocating sales resources or building territories on flawed assumptions (which only come to light when the field team executes the plans). Redesigning sales territories or deploying route optimization software without first mapping your existing baseline is like building a house without a blueprint.

When sales operations teams jump straight into boundary balancing or rep scheduling, they risk optimizing around outdated assumptions, hidden coverage dead zones, or inaccurate account counts. Visual data mapping acts as the essential diagnostic phase of location intelligence. It exposes performance disparities across regions, highlights high-volume account clusters, and reveals where field rep capacity is actually needed. Traditional enterprise GIS platforms make this baseline analysis painfully difficult by requiring technical data layers, specialized shapefiles, and developer support. Modern business location intelligence, like eSpatial replaces that engineering overhead with a fast, intuitive visual platform built for commercial speed.


Evaluation Factor

Business Location Intelligence (eSpatial)

Traditional Enterprise GIS (Esri / QGIS)

Primary User

Sales Operations, Revenue Leaders, Field Managers

GIS Engineers, Urban Planners, Data Scientists

Technical Skill Floor

Zero code; native spreadsheet & CSV import

High; requires spatial SQL, Python/R, or shapefile expertise

Time to First Map

Under 15 minutes

Days to weeks (requires layer setups & formatting)

Primary Data Source

Spreadsheets (CSV/Excel), Salesforce

Spatial shapefiles, GeoJSON, raster imagery, CAD layers

Core Business Outcome

Data analysis and visualization, territory balancing, route optimization

Environmental modeling, urban zoning, utility tracking

How Does Geo Mapping Turn Raw
Spreadsheets into Actionable Insights?


Geo mapping software turns critical business datasets into actionable business insights by linking raw location records directly to geographic boundaries, heat density gradients, and proximity radiuses.

You avoid scanning rows of address columns and immediately visualize regional performance, identify market gaps, and uncover customer concentrations on an interactive visual map. Its faster and more intuitive and the perfect tool for collaboration.

2 people reviewing ZIP code heat map
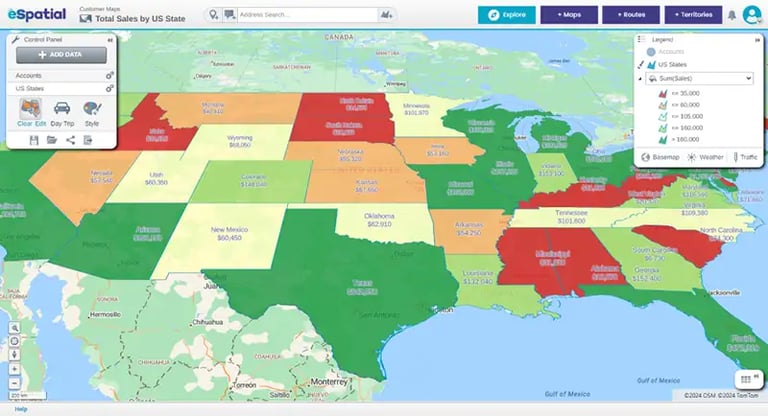
Regional heat map by US state

How Do Boundary Linked Maps Reveal Regional Performance?

Boundary-linked mapping connects your sales figures directly to geographic regions like ZIP codes, counties, or states. By automatically color-coding boundaries based on total revenue or account volume, these visual reports transform your critical KPIs into clear regional trends.

Commercial leaders can instantly spot thriving territories in dark green and underperforming regions in light shades. This immediate visual clarity makes executive reporting effortless and points directly to where strategic support is needed most. So, better data-backed decisions are made faster than ever.

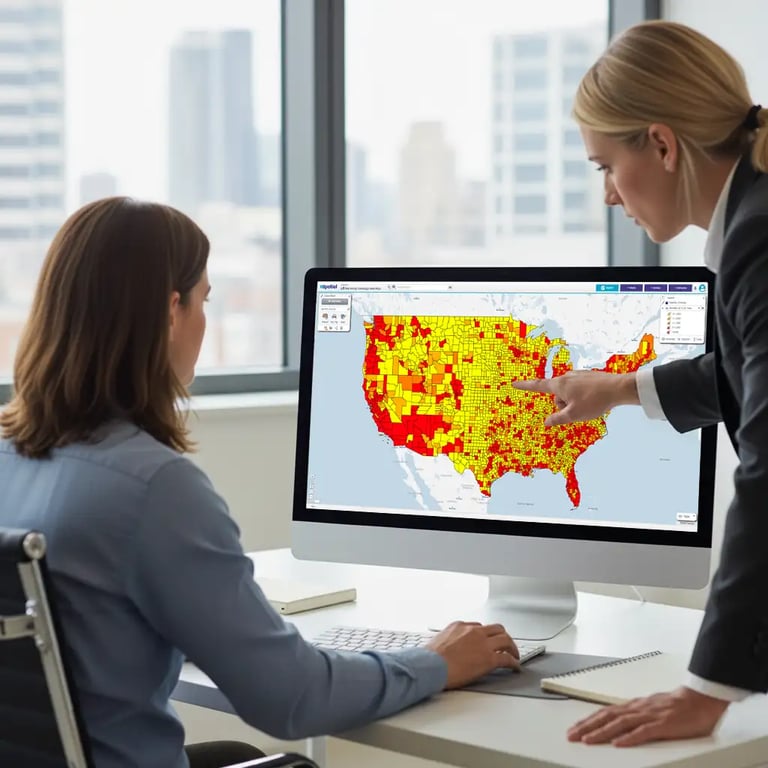
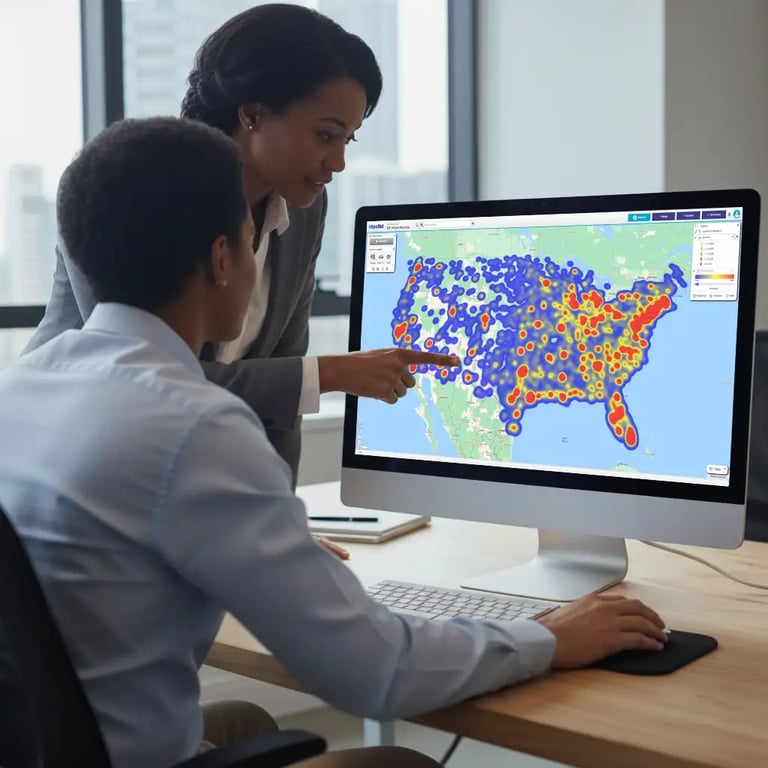
2 people reviewing hotspot heat map on desktop device
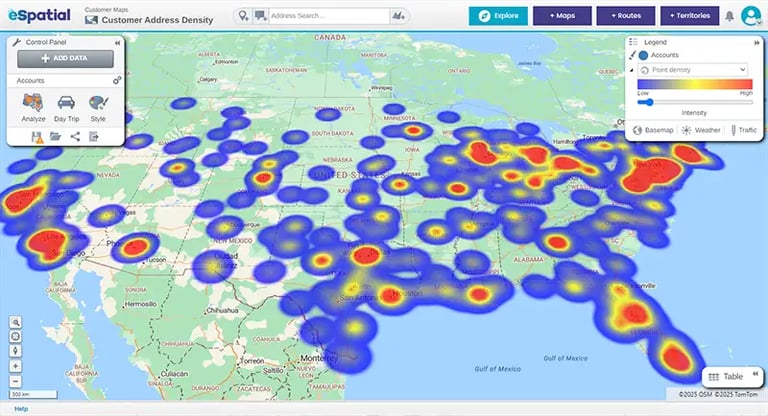
Hotspot heat map, USA

How Do Heat Maps Expose Customer Density and White Space?

Heat maps replace individual account markers with thermal color gradients to highlight customer density and market saturation. Bright "hot spots" signify dense clusters of high-value clients, while cool zones reveal untapped white space in your market coverage.

During strategy meetings, heat maps eliminate guesswork by providing objective visual proof of where demand actually lives. Sales operations can quickly evaluate whether new sales hires are necessary or if existing accounts are simply clustered inefficiently.

Woman reviewing heat map on desktop computer
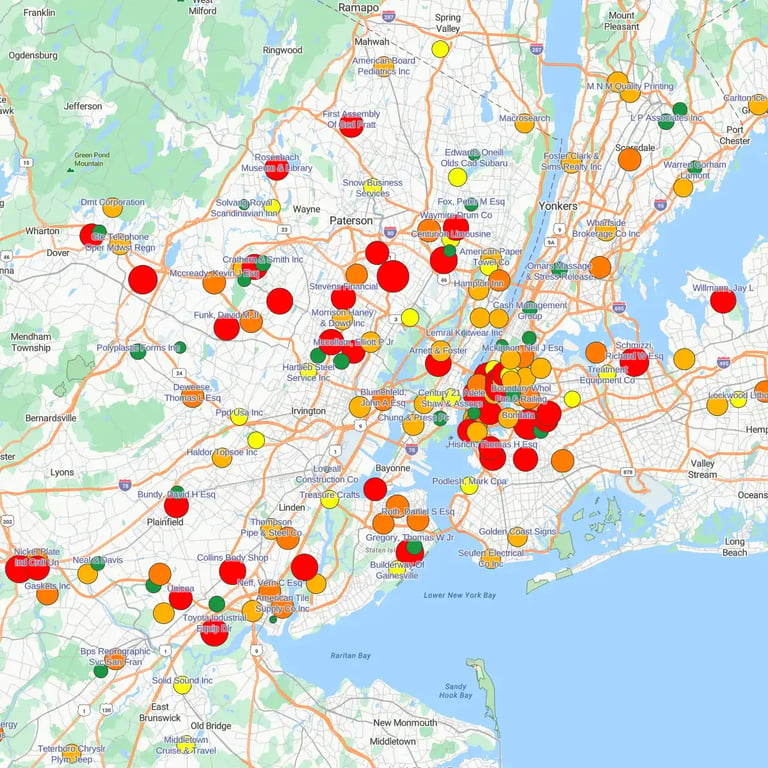
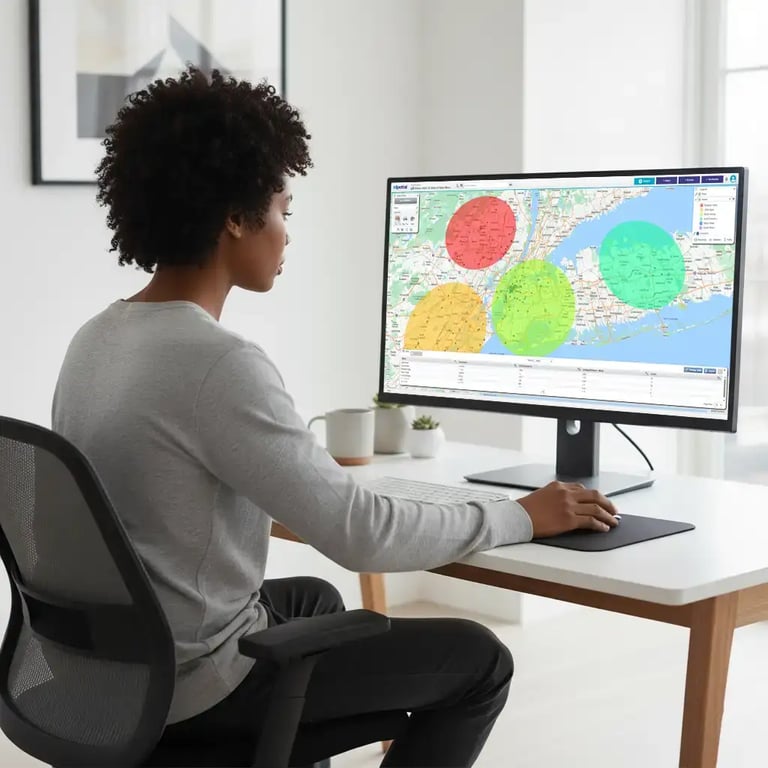
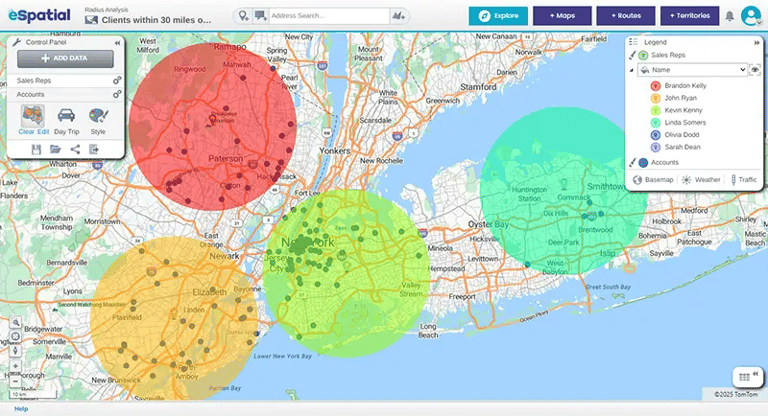
Radius map, New York

How Do Pin Maps and Radius Buffers Detail Local Coverage?

Pin maps plot exact customer addresses as precise visual markers (of pins), giving field teams an accurate account-level view of their territory. Combining pin maps with radius or drive-time buffers adds immediate spatial context around key accounts or field rep home bases.

Drawing a 30-mile or 45-minute drive-time ring around a central account immediately shows which clients fall within easy reach and which accounts are geographically isolated. This fast visual check helps field managers spot coverage gaps long before setting up formal daily routes.

How Do You Create Your
First Geo Map in 3 Simple Steps?


Creating a geo map requires three simple steps: uploading your customer spreadsheet or connecting your Salesforce instance, mapping address or geographic boundary columns, and selecting your preferred visualization style. In under 15 minutes, raw customer records transform into interactive pin maps, heat layers, and executive-ready visual reports without writing code or requiring specialized GIS training.

1
Step 1

How Do You Connect or Upload Your Spreadsheet Data?

Starting your first visual map takes only a few clicks. You can upload existing Excel or CSV files directly into the platform, or link your Salesforce account for continuous automated data syncing.

There is no need to pre-format complex geographic shapefiles or rewrite database code. As long as your file contains basic location fields—such as street addresses, zip codes, states, or lat/longs, the system reads and processes your customer records automatically.

2
Step 2

How Do You Plot and Link Data to Geographic Boundaries?

Once your dataset is uploaded, the software automatically detects your location columns and matches them to accurate geographic coordinates or administrative boundaries.

You simply select whether you want to display individual account pins, color-code geographic boundaries by total sales volume, or generate thermal heat layers. The platform handles the underlying spatial math instantly, turning tabular rows into clear, interactive visuals.

3
Step 3

Create Your First Geo Map

With your map generated, you can filter data on the fly, apply radius buffers around key regions, or drill down into specific account details during strategy discussions.

When you are ready to share your findings, export high-resolution map images for executive presentations or share secure, view-only web links across your revenue team. This ensures every stakeholder stays aligned around verified location insights.

See Your Customer Data Story On An Interactive Map


What is the 3-Stage Location
Intelligence Workflow?


The 3-stage location intelligence workflow is a structured approach that moves commercial teams from visual data analysis to territory design and field route execution. By illuminating customer data first, designing balanced sales boundaries second, and optimizing travel routes third, revenue operations ensure field execution is optimized for market reality.

1
Stage 1

How Do You Illuminate and Analyze Customer Data?

Focus on transforming raw customer location records into visual pin maps, heat layers, and boundary-linked reports. By analyzing baseline performance and customer density first, commercial leaders gain actionable clarity (we call them “aha” moments) without getting bogged down in spatial engineering.

This initial insights gathering phase exposes regional gaps, validates assumptions, and lays the essential groundwork for downstream territory alignment. Understanding your baseline data story first ensures every subsequent operational decision addresses actual market demand.

2
Stage 2

How Do You Design and Balance Sales Territories?

Armed with clear visual insights, teams transition to Stage 2 to build equitable sales territories. Operations leaders construct balanced boundaries, align workload and revenue potential across sales reps, and eliminate unfair quota disparities.

Because this design phase builds directly on Stage 1 data visualization, boundary adjustments are rooted in verified customer density rather than guesswork. This eliminates rep frustration and aligns sales capacity directly with market potential.

3
Stage 3

How Do You Optimize Field Travel and Execution?

Turn optimized sales boundaries into daily field productivity through multi-stop route planning. Field reps receive efficient travel schedules that reduce weekly driving hours, cut fuel costs, and increase face-to-face customer visits.

Deploying route optimization at this final stage ensures field reps navigate well-designed territories built for maximum revenue yield. The result is a fully integrated commercial workflow where visual data insights directly drive field productivity.

How Should You Evaluate
Business Geo Mapping Software?


Business geo mapping software should be evaluated on ease of use, visual analysis capabilities, boundary flexibility, enterprise-grade security, and platform scalability. Commercial leaders require a zero-code solution, analyses data, generates instant spatial insights, and scales seamlessly as operational mapping needs grow.

When selecting a mapping solution for business strategy, revenue operations leaders should focus on operational agility rather than complex engineering tools. Software that requires specialized GIS scripting or dedicated IT support quickly creates bottlenecks and delays strategic decision-making. A practical evaluation focuses on five essential capability pillars:

Seamless Data
Ingestion

Easy data upload without manual geocoding fees or complex data transformation scripts.

Intuitive Visual
Analysis

Generates account pin maps, thermal heat density layers, and boundary-linked visuals automatically, allowing non-technical users to analyze regional performance instantly.

Boundary &
Geographic Flexibility

Includes built-in, up-to-date postal boundaries, administrative regions, and country datasets for immediate data linking.

Enterprise-Grade
Security & Governance

Enforces ISO 27001 compliance, role-based access permissions, and secure single sign-on (SSO) to safeguard sensitive customer data.

Scalable Location
Intelligence

Offers a direct path to advanced territory balancing and multi-stop field routing when your operational strategy expands into Stage 2 and Stage 3.

Frequently Asked Questions


Geo mapping software for business focuses on rapid visual data analysis and zero-code usability for sales operations and commercial leaders. Traditional GIS (Geographic Information Systems) software is designed for spatial engineers, requiring specialized coding, shapefile management, and technical training for complex environmental or urban modeling.

Business geo mapping software connects directly to CSV/Excel files and Salesforce CRM. Users can drag and drop spreadsheets or enable continuous CRM API syncing, automatically mapping address columns and revenue metrics to precise geographic coordinates in minutes.

A boundary-linked map (or choropleth map) connects numeric metrics, such as total revenue or account volume, directly to predefined geographic regions like zip codes, counties, or states. The software automatically color-codes these boundaries by value density, allowing managers to spot regional trends and performance disparities instantly.

With intuitive location intelligence platforms like eSpatial, creating a visual geo map takes under 15 minutes. The software automatically processes uploaded address data, detects location fields, and generates interactive pin maps, heat layers, or boundary visuals without manual geocoding.

Yes. Visual geo mapping serves as Stage 1 of a complete location intelligence strategy. Once baseline customer insights are illuminated on a map, commercial teams can seamlessly upgrade to Stage 2 (territory design and balancing) and Stage 3 (multi-stop field route optimization) as operational requirements grow.

Evaluate eSpatial Against Your Mapping Needs


You appear to be offline at the moment, this notice will disappear once your device can connect to the internet again