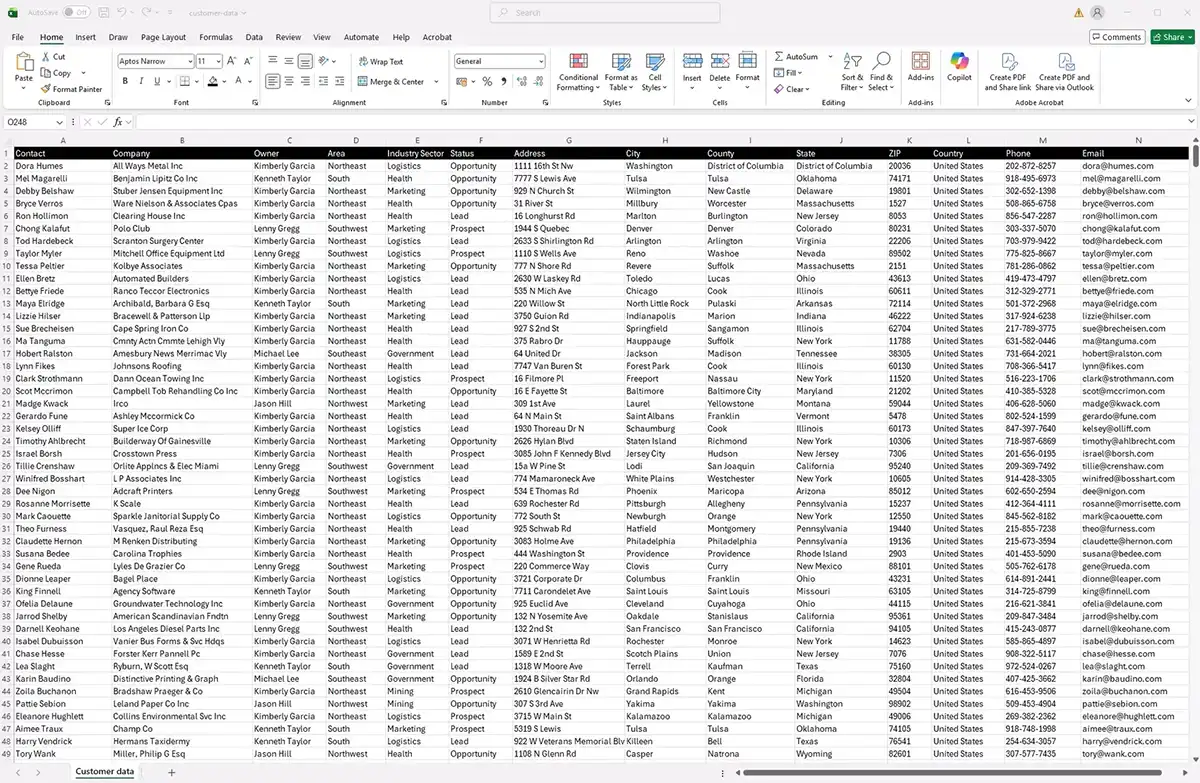
A modern mapping program is more than a static picture, it's a complete data intelligence tool. Stop guessing and move beyond spreadsheets to instantly identify patterns, uncover hidden revenue, and align your assets directly with customer demand.
Strategic Mapping Solutions
-
 Reporting & Visualization
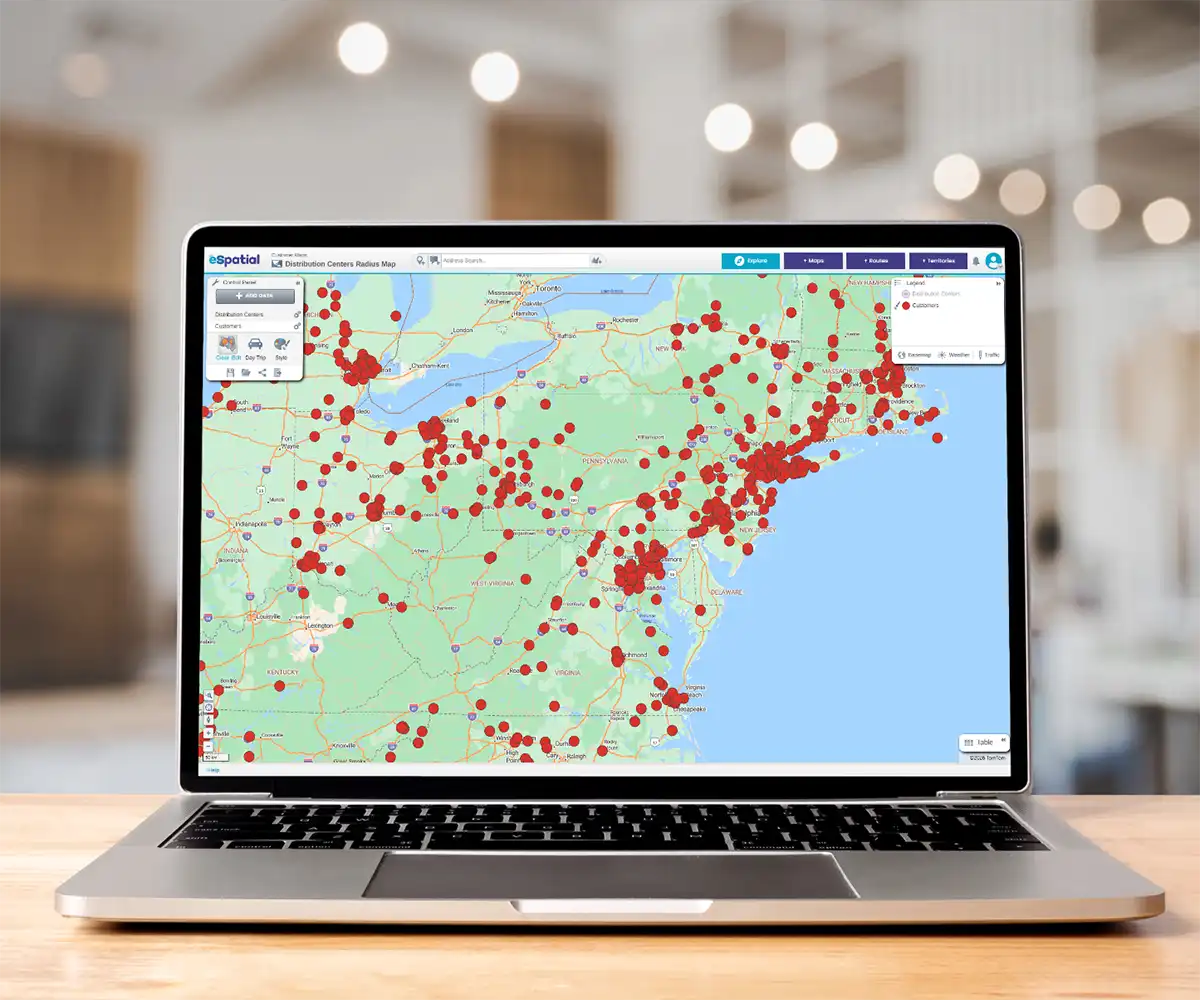
Tell a data story the boardroom understands. Generate presentation-ready, color-coded, and radius maps from your data instantly.
-
 Market Analysis & Trends
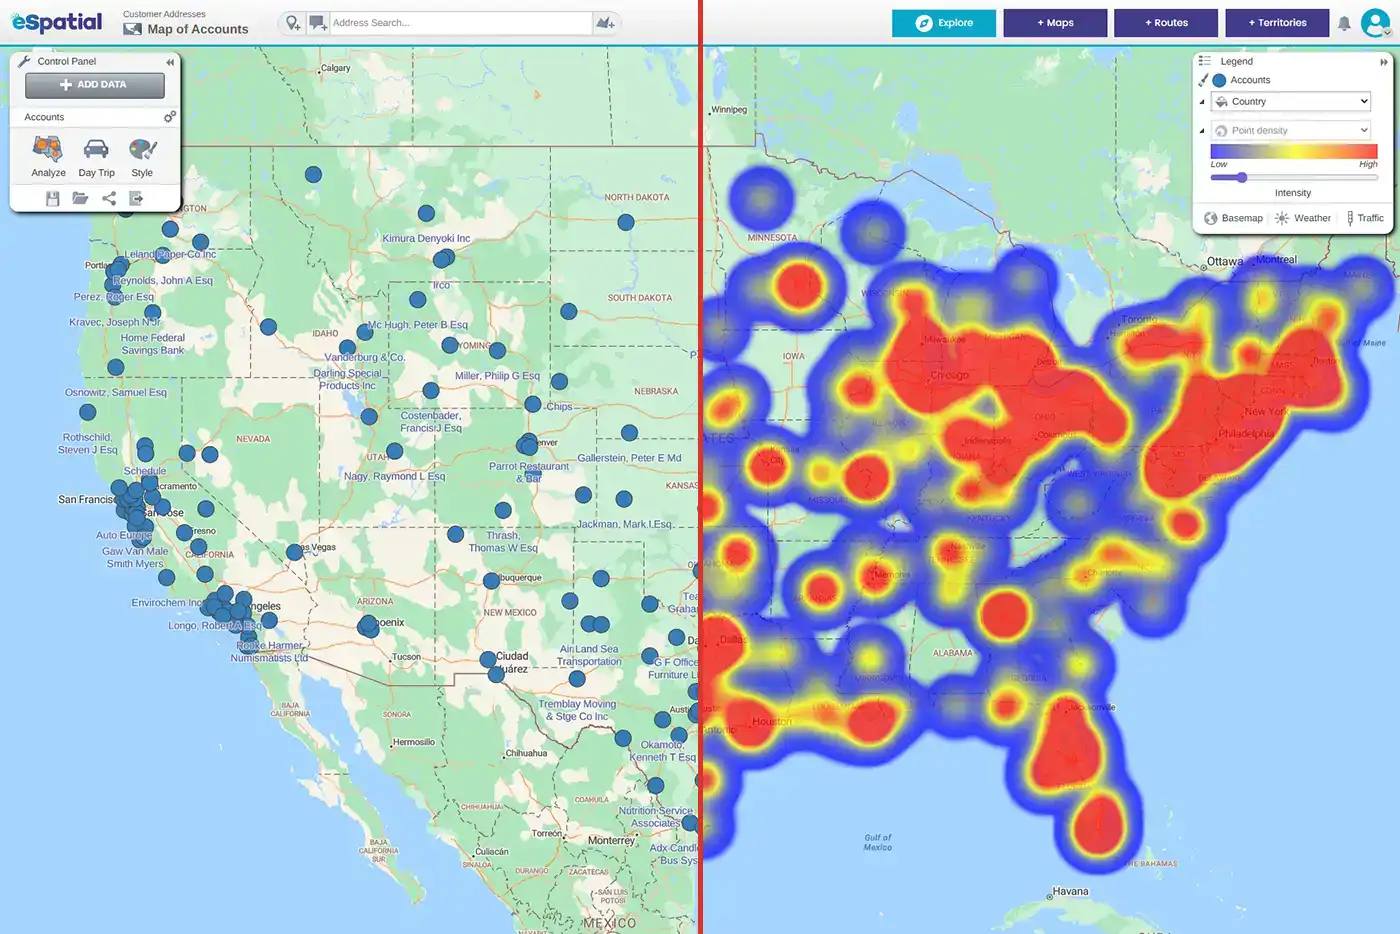
Find your white space. Use heat maps and spatial analysis to spot regional gaps, untapped potential, and de-risk expansion.
-
 Strategic Location Decisions
Align physical assets with demand. Map workforce locations securely, optimize site selection, and mitigate risk with proximity analysis.
-
 Sales Productivity
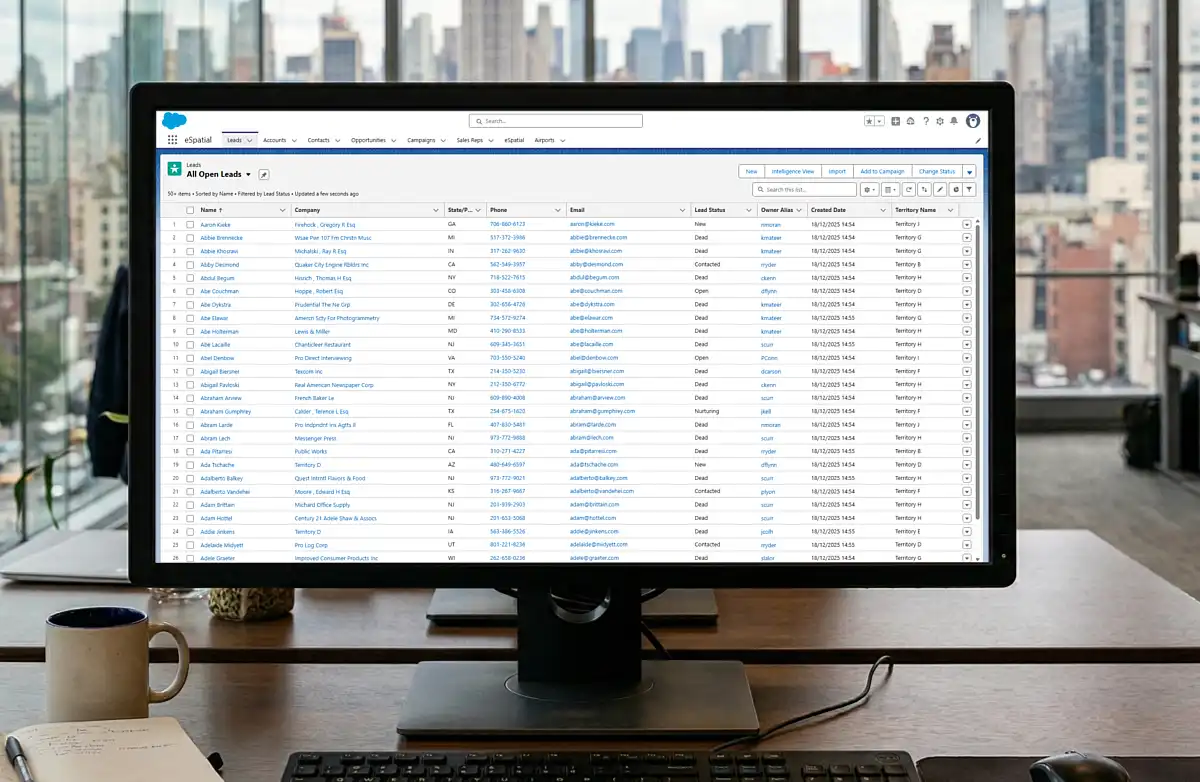
Give reps back 5 hours a week. Natively map your CRM data to visually cluster high-value accounts and analyze your sales pipeline.
Enterprise GIS Power, Easy Learning Curve

eSpatial provides secure, cloud-based mapping programs ready on day one.
- ISO 27001 Compliant
- Enterprise SSO (Single Sign-On)
- Role-based permissions
Industry Spotlight: Spatial Intelligence In Action

Stop guessing where your next clinic belongs. Most healthcare leaders rely on spreadsheets that hide the truth about patient access . eSpatial turns that data into a clear story, allowing you to validate that 70% of employees are within a 10-mile radius of your care.
Whether you are identifying service gaps or presenting a winning Request for Proposal (RFP), we give you the visual proof needed to expand with confidence and close more business.

Take the driver's seat in your sales process. Relying on distributors to bring you leads is a passive way to grow. Innovative manufacturers use eSpatial to gain full visibility over end customers, allowing sales reps to spend 30% more time selling and 67% less time onboarding. By mapping your install base and identifying underserved territories, you can ensure your technicians and sales reps are positioned exactly where the revenue is.

Master the complexity of thousands of locations without breaking a sweat. Managing a national distribution network requires more than just a basic map—it requires account-based precision.
World leading distributors use eSpatial to balance workloads for thousands of reps, ensuring full-time staff are optimized and service costs are lowered. From cutting route creation time in half to identifying high-priority leads near existing stops, we help you maintain perfect data hygiene while doubling your team's productivity.

Reclaim your shelf space from the road. Managing over 17,000 retail locations shouldn't feel like a guessing game. Leading distributors and retail managers use eSpatial to move from broad ZIP code areas to precise account-based territories, ensuring merchandising and reset teams are matched to store workloads based on actual rep availability.
By cutting down on unnecessary "windshield time," your reps spend more time in-store where the revenue is generated—helping you lower service costs and improve the shopping experience across your entire national footprint.

Move 32x faster than the market. Speed is the only currency that matters when a franchise opportunity arises. While your competitors spend six days manually mapping boundaries, eSpatial users get territory definitions agreed upon in 90 minutes.
By providing a single source of truth for franchise boundaries, you can eliminate disputes and double the number of client visits your team makes every week.

Turn days of reporting into 20 minutes of high-impact visualization. In the engineering and HVAC space, performance visibility is the difference between a market leader and a laggard.
eSpatial allows regional managers to see the performance of hundreds of offices at a glance, cutting annual reporting time by an entire month.
Whether you are identifying coverage gaps or presenting complex market trends to the president, our tools make your data "come alive," ensuring you spend less time in the office and more time on business strategy.

Build a service network that actually follows your fleet. In the automotive world, "close enough" is not good enough for your customers. Leaders use eSpatial to visualize every garage and driver location, allowing them to shift from expensive Original Equipment Manufacturer (OEM) repairs to high-quality local independents.
By seeing the "hidden map" of your network, you can increase local network usage to 70% and cut route planning time from 10 minutes to mere seconds.

Quit leaving money on the table at the job site. Your equipment is only valuable when it is in the right place at the right time. Our customers use eSpatial to bridge the gap between "gut feeling" and actual construction data, identifying $100,000’s in potential shipping savings by finding the most cost-effective plants.
Use these maps to challenge dealer perceptions, find gaps in your national coverage, and proactively target upcoming projects before the competition even knows they exist.

Unlock your next $1,000,000 in growth. When your safety or specialist teams double in size, legacy alignment tools just cannot keep up. Our clients use eSpatial to finalize sales territories right in front of stakeholders, cutting project delivery times from a year down to just four months.
This clarity allows you to unlock an additional 10% in sales potential and ensure your high-value reps are not wasting their day behind a windshield.

No more board presentations with spreadsheets. Start sparking real strategy. Community banks use eSpatial to transform dense financial data into visual insights that actually drive profitability.
By layering branch locations with demographic and customer analytics, leaders have created strategic maps to identify new branch opportunities and areas for consolidation.
It is time to ditch "dated" mapping for a fresh, professional output that wows executive management and turns numbers into actionable growth.

Optimize your workforce while the competition is still calculating. Managing 1,000+ sales reps across the country is a logistical nightmare without a visual guide. eSpatial helps staffing leaders strategically place talent and identify new office locations based on real market demand.
By optimizing your office assignments and reducing travel time, you stop wasting fuel and start driving the operational efficiency that leads to increased revenue.
Mapping Software: Your Intelligence Engine
To Visualize, Plan, and Optimize

1. Dynamic Visualization & Custom Mapping
Turn dense spreadsheets and complex spatial data into interactive maps that stakeholders understand at a glance. eSpatial consolidates all your information onto one map, revealing the patterns and gaps that spreadsheets hide.
- Filter & Combine Datasets: Isolate specific criteria (e.g., ZIP codes, sales reps, or verticals) to find answers in real-time.
- Build Custom Visuals Fast: Use the polygon and lasso tools to draw specific boundaries. Color-code regions, adjust pin shapes, and generate regional heatmaps to make key data attributes stand out.
- Accelerate Learning: Spotlight areas with the highest potential based on your business data and instantly visualize where your campaigns are converting.

2. Strategic Territory Alignment & Expansion
Choosing a site or assigning a territory without location intelligence leads to increased costs and missed opportunities. Use mapping software to evaluate every option based on customer proximity, existing infrastructure, and logistics.
- Find Your White Space: Overlay customer and prospect data with current sales rep coverage to spot underserved regions and high-growth hotspots.
- Optimize Asset Placement: Place proposed hubs, facilities, or teams to instantly simulate travel times and ensure strategic placement.
- Balance Coverage: Ensure your physical assets and field teams are perfectly aligned with actual market demand.

3. Route Optimization & Mobile Efficiency
Take control of your operational costs by identifying inefficiencies in your territory coverage that cost thousands in wasted mileage.
- Identify Cost Savings: Calculate the fastest routes for sales and operations teams, driving down fuel costs and eliminating unnecessary drive time.
- Empower Field Teams: The eSpatial mobile app puts the power of route optimization directly into the hands of your reps, keeping them connected and productive on the move.
- Plan and Navigate: Allow reps to optimize schedules up to 20 days in advance and get instant turn-by-turn directions to their next stop without having to return to the office.
Support From Our Experts When You Need It

You're the expert on your data and line of work, but you may need some backup to complete your project. Your support team includes mapping (GIS) experts who will help you onboard faster with one-to-one guidance. They'll walk you through setting up your maps and map software, importing your data, and building the specific analyses that matter most to your business goals.
Mapping Guides
-
 Talent Manager's Guide to Mapping
Eliminate recruitment blind spots, optimize workforce distribution, and drive data-backed human capital growth.
-
 IT Analyst's Guide to Mapping
Bridge the gap between raw data and business impact with secure, scalable location intelligence.
-
 Sales Team's Guide to Mapping
Eliminate territory blind spots, optimize field productivity, and drive data-backed growth across your entire organization.
-
 Marketer's Guide to Mapping
Eliminate data blind spots, drive regional campaign ROI, and turn geographic insights into a strategic advantage for your entire marketing organization.
-
 Operation Manager's Guide to Mapping
Eliminate operational friction, optimize resource distribution, and turn location intelligence into a competitive field advantage.