4.8/5 of 53 reviews
4.3/5 of 38 reviews

Analyse ZIP Codes With Precision


Use a powerful ZIP code mapping tool to visualize territories, optimize routes, and uncover hidden trends

ZIP code regional heat map, USA

Help With Your ZIP Code Mapping Needs


You know your business. We know mapping software.

The difference: You aren't just getting software; you get direct access to qualified mapping experts who guide you from onboarding to execution.

How We Help

  • Integration: We assist with complex data connections
  • Onboarding: We ensure you launch your project without technical delays
  • Instant Access: Click the orange icon to speak to a human now
Regional heat map being reviewed on a projector

1. Color-coded Maps: Visualise Data


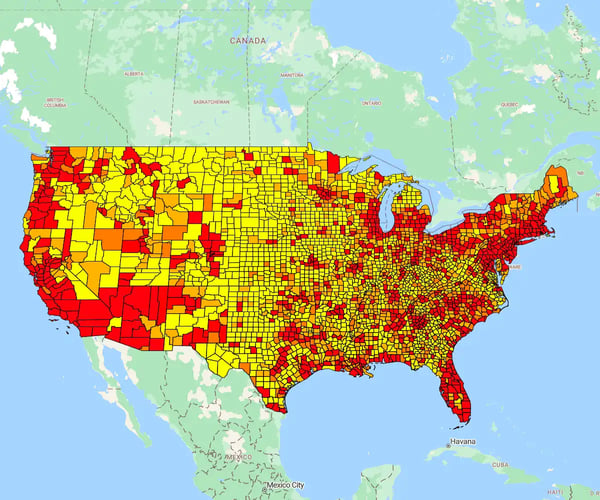
Use color ranges to illustrate data density and specific values across ZIP codes. Visual coding turns abstract spreadsheets into an instant read on performance. You can spot high-value territories or gaps at a glance.

Work smarter: Save your custom color palettes as templates. This allows you to apply consistent styling to new datasets instantly, saving hours of manual formatting. Learn how to create color-coded ZIP code maps with our quick how-to guide.

2 people reviewing a regional heatmap in eSpatial for Salesforce

What is a Color-coded Map?

Assign unique colors to individual ZIP codes to differentiate areas instantly.

Visual distinction makes it easy to see independent territories and precise geographic limits at a glance. You stop guessing where one zone ends and another begins.

2 people reviewing a regional heat map in Florida

Group ZIP Codes: Visualize Status

Group multiple ZIP codes by color to represent shared values or status.

Why it matters: This creates an instant visual binary for complex data. You don't need to read the data; you just see the pattern.

Real-world example: Service Coverage

  • Green: Region covered by a service team
  • Red: Region not covered
2 people reviewing a regional heat map of the US

Link Data to Regions

Upload Excel data and automatically link it to specific ZIP code boundaries. This layers depth onto your visual map. You see the high-level status (covered vs. not covered) by color, but access the hard data with a single click.

  • Visualise status: Use color codes to see who is covered instantly
  • Reveal details: Click any region to open an info box displaying the spreadsheet data attached to that boundary, such as customer counts or service engineer availability
2 people reviewing a hotspot heat map

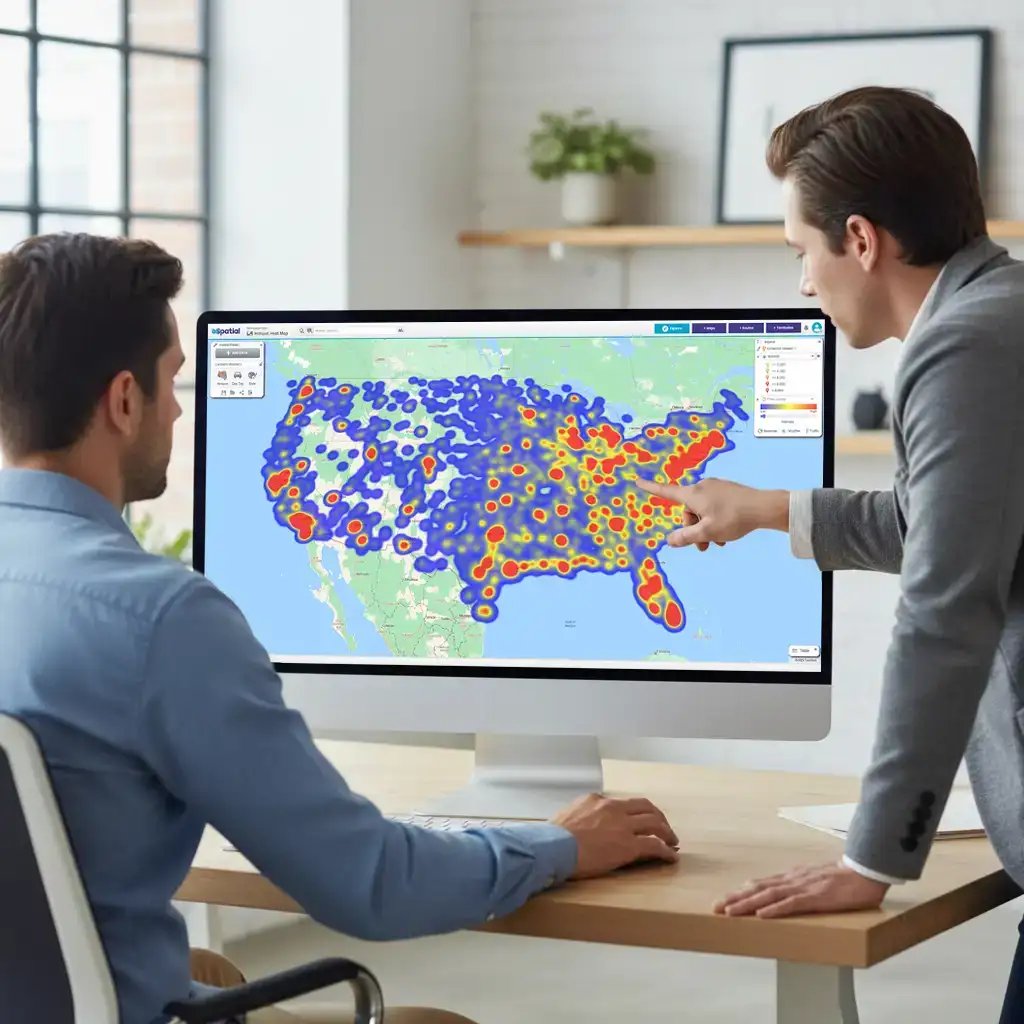
Color Code Vs. Heat Map

Choosing the right visual style determines whether your data is understood or ignored.

  • Color-coded maps: Best for clear, distinct categories (e.g., "Covered" vs. "Not Covered"). Use this for binary or text-based values.
  • Heat maps: Best for showing intensity or density across a range of integer values.

Real-world Example

Mapping population density:

  • Dark red: High density
  • Light pink: Low density
  • The range: Shades in between capture the nuance of the data distribution
Person uploading data onto a map

Layer Data on a Color-coded ZIP Code Map

A single dataset tells only half the story. Layering additional data points creates a multidimensional view of your market.

How it Works

  • Reuse: Create and save your base color-coded map to use as a template for future analysis
  • Overlay: Plot distinct variables—such as competitor locations—directly onto your service regions to spot threats or gaps instantly

Get Started With eSpatial Today

Our team is here to help you every step of the way

Customer success team

2. ZIP Code Territories: Balance Workloads


Create ZIP code territories from scratch

Sales territories are the backbone of revenue. Using ZIP codes allows for granular precision that counties or states simply cannot match.

The goal: Ensure every sales rep has an even workload. This is the key to a fair, motivated, and high-performing team. eSpatial territory mapping software can help:

  • Realign: Start fresh or upload existing maps to redesign borders instantly
  • Balance: Use weighted data—such as demographics or sales value—to mathematically verify that territories are fair

Get started: Sign up for a free trial or log in to launch the Territory Map Maker now.

Step 1

Create Manually

After logging and opening the Territory Builder, you see two options. To Create Manually or Create from File. Select Create Manually.

Territory alignment options

Step 2

Select Your ZIP Code Territory File

Make sure you have the territory data on the first sheet of your file and that it is saved in CSV or XLS format.

Select data on your computer

Step 3

Configure Your ZIP Code Territories

Align your uploaded data to the map boundaries.

The Steps

  1. Select region: Choose the boundary foundation for your territories (ZIP, county, state)
  2. Match columns: Point the software to the specific data column that matches that boundary
  3. Identify: Select the column that names the territory or the sales manager responsible for it
Configure your file for import

Step 4

Edit Your ZIP Code Territories

Once loaded you can edit, align and balance territories.

Add area button

Step 5

Balance Your Territories

The Steps

  1. Initiate: Click Add Balance
  2. Source: Select your dataset. Pro tip: Pull directly from your CRM to ensure you balance territories on real-time data
  3. Define: Choose your metric—current sales pipeline, account value, or recent performance
  4. Execute: Click Complete. You will instantly see weighted balances displayed next to each territory
Sign up for a free trial

No credit card required

3. ZIP Code Heat Maps


Use graded color shading to reveal the aggregate value or density within a ZIP code.

This turns flat numbers into a visual hierarchy. You instantly spot high-performing hotspots (darker shades) versus low-activity cold zones without reading a spreadsheet.

Real-world Application

Map total sales volume per territory:

  • High intensity: Dark colours indicate high revenue
  • Low intensity: Light colours indicate potential growth areas

Learn how to create your own regional heat map in our quick and easy how-to guide.

Team meeting with Texas heat map on projector screen

ZIP code heat maps use cases:

  • Market overview: Gauge total performance in seconds
  • Performance extremes: Identify high and low achievers at a glance
  • Trend spotting: Uncover sales patterns for specific products by location
  • Investigation: Target specific areas based on sales density

Outside Analysis: Spot the Gaps

Don't limit insights to inside the lines. Identifying data points that fall outside your defined ZIP code boundaries reveals coverage gaps. This highlights immediate opportunities for territory expansion.

Frequently Asked Questions


Why Map My Excel Data?

The big difference
Spreadsheets are excellent for storing data, but they cannot answer the crucial question: Where? Static rows hide reality. Mapping software instantly transforms those rows into a visual landscape.

The Payoff

  • Visualize: Spot customer clusters and territory gaps instantly
  • Decide: Stop guessing based on pivot tables and start executing data-backed strategies

Ready to Create Your Own ZIP Code Maps?

You appear to be offline at the moment, this notice will disappear once your device can connect to the internet again