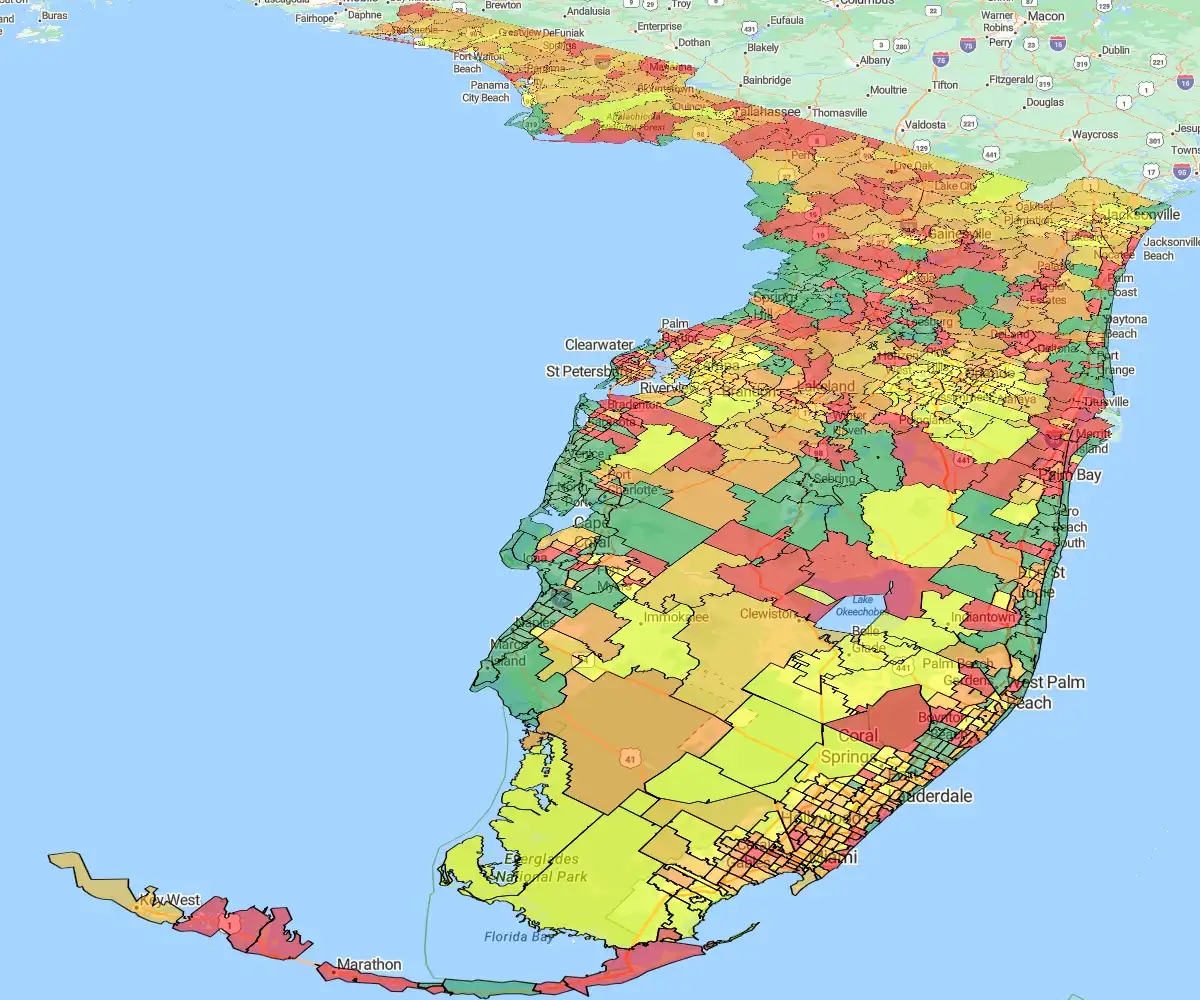
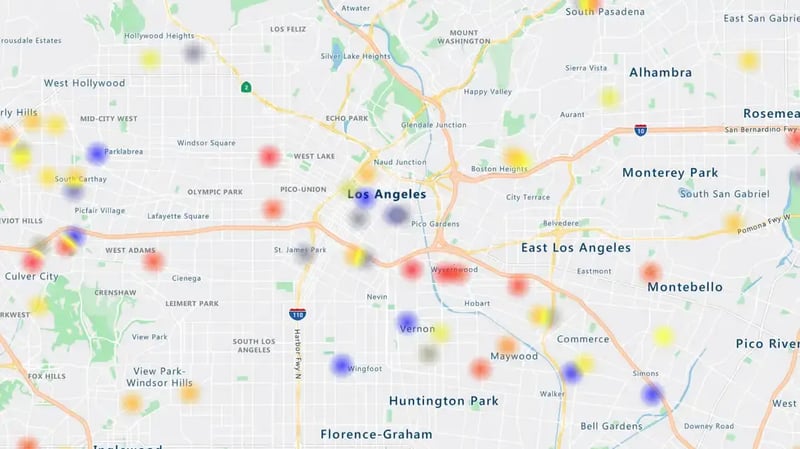
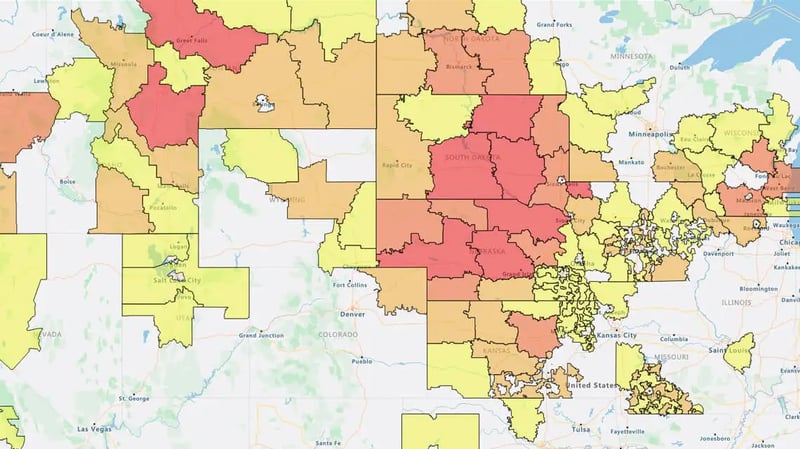
Heatmaps are an invaluable visual tool for Sales, marketing, and operations teams who must report performance at the ZIP code level. ZIP codes are essential for many industries, like retail, real estate, and restaurant franchises.

Most sales and service territories are optimized at a Zip code level too. Presenting your data at a granular level can be daunting and time-consuming if it lives in Excel or spreadsheets. Engaging others and collaborating using Excel or spreadsheets is challenging, but there is a better way with heatmaps.

ZIP Code Heat Maps use color to reveal different intensity levels of your data. For example, a sales operations team may want to explore new possibilities for sales territory alignment designs. Before the alignment, you can use heatmaps to analyze revenue hotspots or whitespaces.

A head of a field service team can use Heatmaps to plot hotspots for service calls, resulting in better resource allocation and service territory design. A marketing manager might map the number of customers in a ZIP code to select a location for an event. The possibilities are endless. With eSpatial, you can quickly create power ZIP Code Heat Maps highlighting data intensities within ZIP code boundaries.

Why Create Heat Maps From ZIP Codes?

To visualize and analyze your data and see patterns that are not visible in spreadsheets. ZIP Code Heat Maps work in most industries with field-based personnel, field assets, properties, and customers. That's because ZIP Code Heat Maps allow you to get a more granular view of their sales or service performance than states or counties would allow. That granularity unlocks new opportunities.

Here are some examples of how ZIP Code Heat Maps are helpful when analyzing performance, identifying expansion opportunities, or planning targeted marketing campaigns.

A Real-world Example for Marketing When Creating a New Campaign

Power mapping software is perfect for marketing professionals who want to analyze marketing data and create new marketing campaigns. For example, identify whitespaces or areas with poor market share.

Asking questions like:

  • What areas should we prioritize our marketing spend?
  • Where is our marketing spend under or over-performing?
  • Where are the sales hotspots?
  • Where are we gaining or losing customers or market share?
  • What locations are a fit for expansion?

Here is How You Can Achieve Those Results Using eSpatial

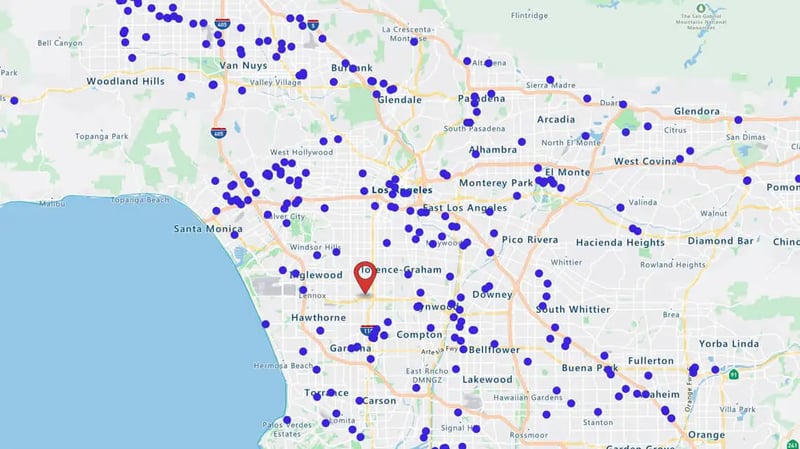
1. Upload your customer dataset to the map

Pin map - Office and customer locations

Customers

Office location

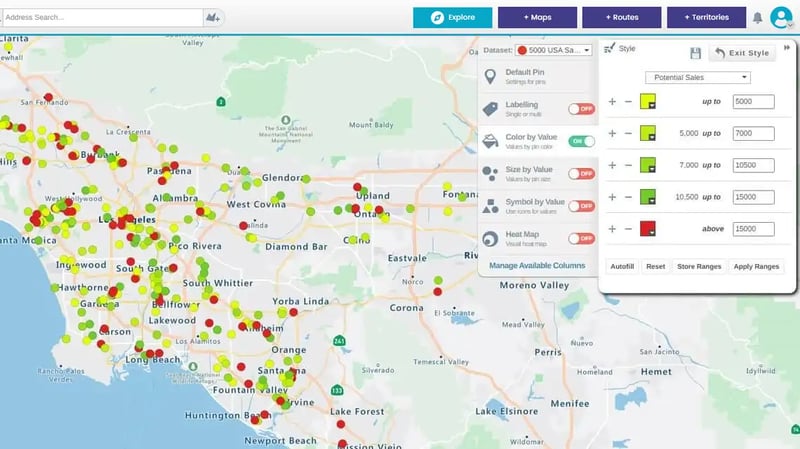
2. Turn on color by value. Select your priority metric (revenue, product sales, customer type, etc.)

Pin map - Color by value option

Color by value showing customers potential sales

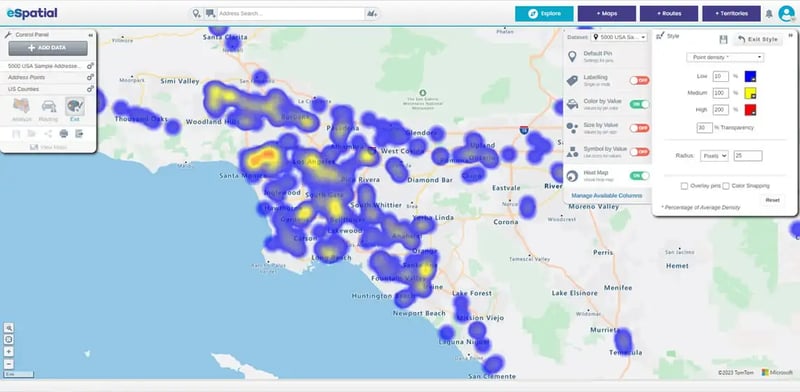
3. Select "style" – in the styling legend, turn on the "Heatmap" option

Pin map - Hotspot heat map

Switch heat maps on

Style button

4. You create a hotspot heatmap highlighting customer clusters

5. See customer locations and reveal whitespaces or hotspots

Pin map - Hotspot heat map whitespaces

Whitespace

Hotspots

6. You can see the cities, towns, neighborhoods, and zip codes to target marketing campaigns

Regional heat map

Low customer density

High customer density

A Real-world Example for Sales Operations When Realigning Territories

Before you design or realign sales or service territories, using power map software is essential for analysis. Once you have uploaded your ZIP codes to your map, you can leverage several analysis types.

With a pin map, you can view your customer locations in relation to your sales or service rep locations. Precious insights are available quickly. Far too often, territory design is out of balance with customer coverage. So, you have a sales rep located too far from customers. Your ideal location for a rep is a weighted center. In other words, representatives are close to customers and prospects, reducing travel times and increasing selling time.

Next, you use a hotspot map to analyze customer location densities further. Do you see imbalances in the cover? Great, you can use these insights to finetune your territory alignments further.

Here is how you can achieve those results using eSpatial

  1. Upload your customer dataset to the map
  2. Turn on color by value. Select your priority metric (revenue, product sales, customer type, etc.)
  3. Select "style" – in the styling legend, turn on the "Heatmap" option
  4. You create a hotspot heatmap highlighting customer clusters
  5. See customer locations and reveal whitespaces or hotspots
  6. You can see the cities, towns, neighborhoods, and zip codes and assess whether to create new, merge, or close territories

A Real-world Example for Retailers When Sourcing New Sites

Below is an example of a Menswear Retail Store and how they use eSpatial ZIP Code Heat Maps to identify opportunities for new business:

  1. Filter the data to show only the ZIP codes with the highest volume of high-value customers.
  2. Export that list of ZIP Codes to CSV so that you have them to reference later.
  3. Return to your map and clear your regional heat map analysis.
  4. Turn on Color By Value on the Demographics ZIP Dataset you use for your ZIP Code Boundaries.
  5. Filter your data to the ZIP codes that you exported earlier.
  6. Analyze the demographics of those ZIP codes using the data in the table to identify any similarities; for example, 10% of the population in that ZIP code are 30-39 Year Old Males.
  7. Note the similarities and clear the filter on the ZIP codes to show all ZIP codes in that county.
  8. Now filter the demographic data to only show ZIP codes with 10% or higher populations of 30-39 Year Old Males.
  9. Overlay this with your customer location points.
  10. You can now see on the map ZIP code areas where you do not have any customers but have a high density of your target market. It could mean an opportunity for a new store or a targeted mail drop in these ZIP codes to generate more business for your existing stores.

Ready to Try a ZIP Code Heat Map of Your Data?

You appear to be offline at the moment, this notice will disappear once your device can connect to the internet again