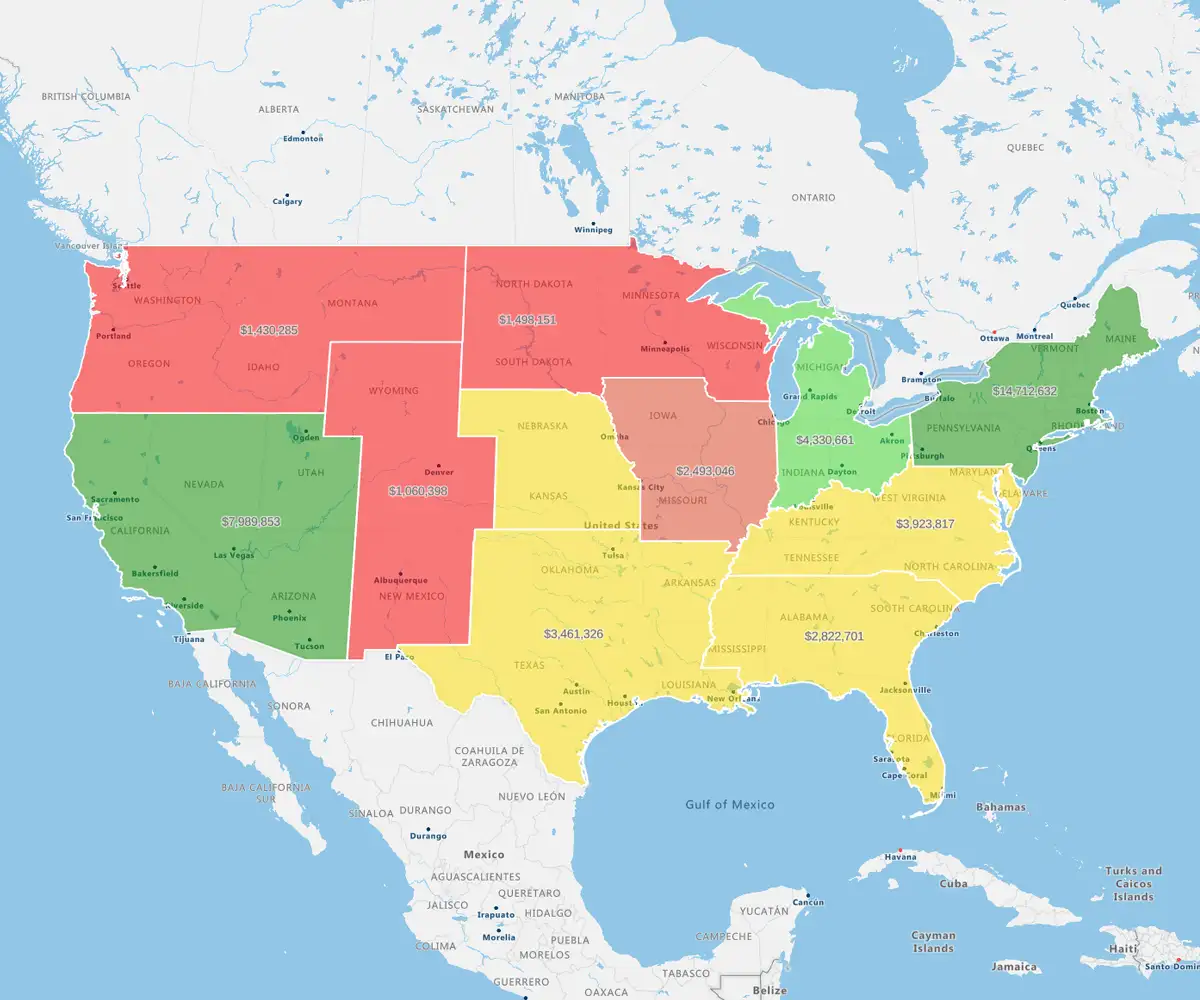
Excel data mapping will help you enhance the performance of your sales, service, and operations teams. By mapping Excel data, teams can make faster decisions and improve operational outcomes. Data-driven insights are the foundation of impactful strategy decisions, turning static spreadsheets into a dynamic tool for growth, operational efficiency, and better results:
What is Excel Data Mapping?
Data mapping in Excel involves linking fields from one dataset to another to ensure accurate alignment and integration, offering valuable insights. Excel mapping data tools like VLOOKUP, INDEX, and MATCH help match data points across spreadsheets or sources. With clean, organized data, you can create clear visual relationships that support better analysis and decision-making.
How to Create Data Mapping in Excel
Step 1
Start with clean, standardized data — remove duplicates and ensure consistent formatting across sources.
Step 2
Use Excel formulas like VLOOKUP, INDEX, and MATCH to connect fields between datasets.
Step 3
Apply conditional formatting or filters to validate mapped values and highlight mismatches.
Step 4
Organize mapped data using pivot tables or charts to visualize trends and ensure everything aligns.
Step 5
Save your mapping logic in a template to reuse or adapt for future projects.
Benefits of Mapping Excel Data
Understand Your Data and Unlock New Insights
Excel data mapping helps you uncover trends, outliers, and relationships that are hard to spot in traditional rows and columns. Studies show that managers using visualization tools are 28% more likely to uncover timely and valuable information than those relying on static dashboards. With our brains wired for visuals — processing images at about 10 million bits per second — mapping data in Excel makes complex data more intuitive and easier to interpret.
Visualize With Interactive Maps
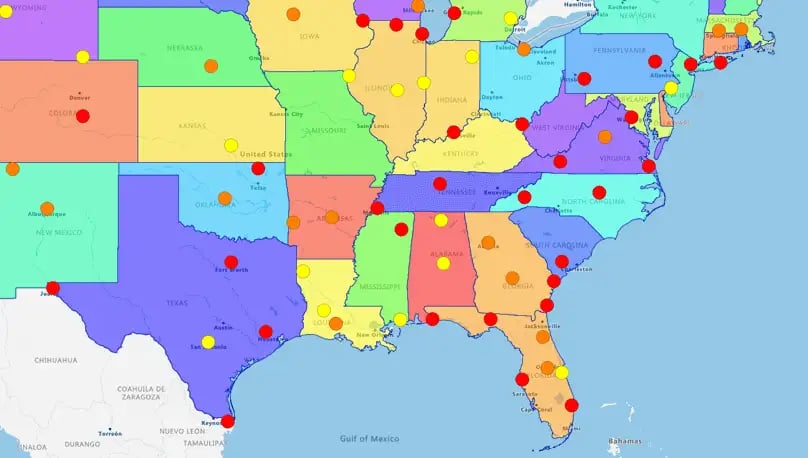
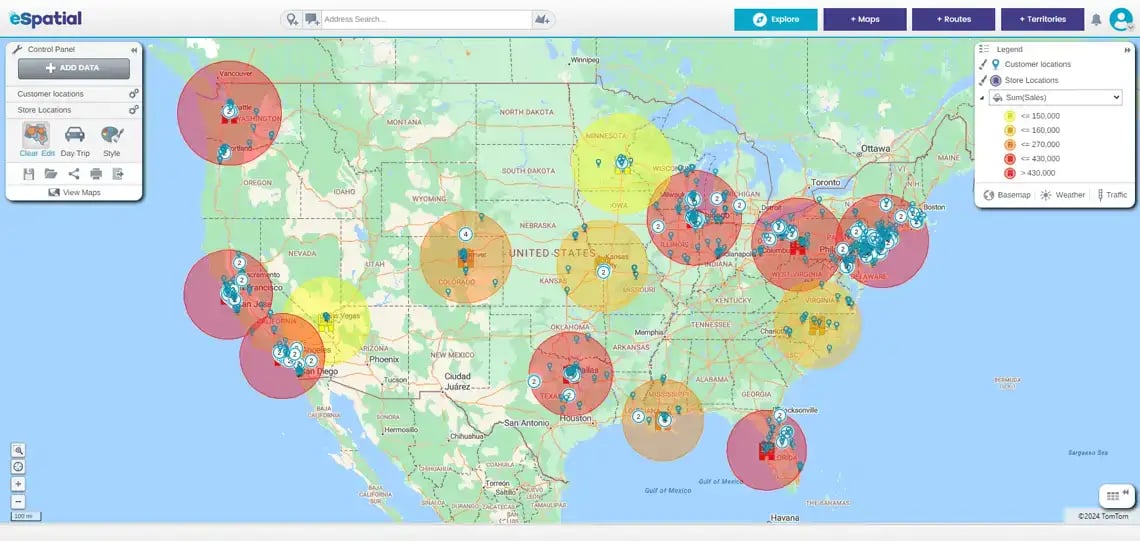
From pin maps to heat maps, Excel mapping visualization tools bring your data to life and offer deeper context.
- Pin maps let you plot addresses on a map from Excel to explore locations efficiently
- Heat maps show where performance is strongest or weakest
- Radius and drive-time maps help assess coverage, proximity, and density, supporting everything from event planning to territory realignment
Improve Results And
Make Strategic Decisions
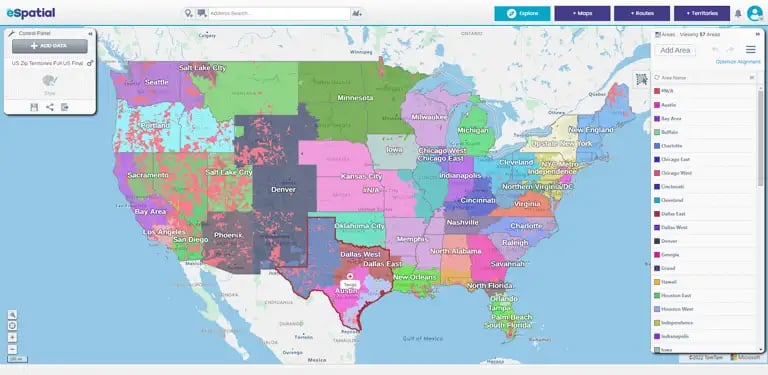
1. Advanced Territory Mapping
Mapping your Excel data enables smarter territory alignment and better rep utilization. Organizations that optimize territories see an average 7% increase in revenue, even without making other changes. With eSpatial's Excel mapping tool, you can rebalance and redesign your territories up to 92% faster than doing it manually.
2. Route Optimization
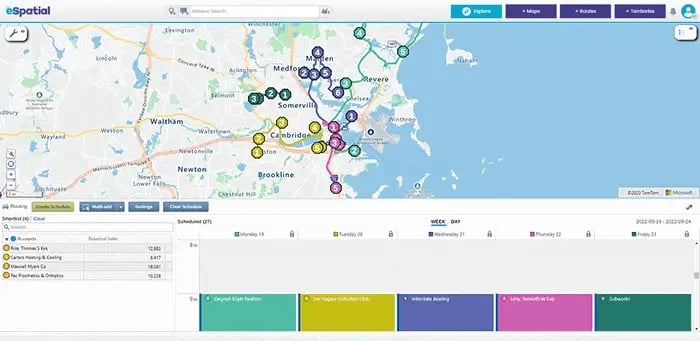
Once your Excel data mapping is complete, route optimization helps your field team spend more time with customers and less time driving. Engel & Völkers doubled its agents' weekly client visits with this strategy, boosting both productivity and service. Automated planning also reduces time spent on logistics and scheduling.
3. Transform Internal and External Communication
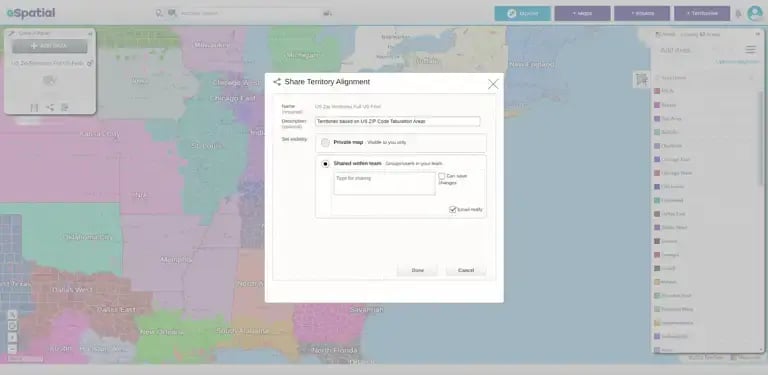
Mapped Excel data becomes a powerful communication tool when shared visually as presentations or PDFs. Live collaboration and clear visuals enhance team engagement and stakeholder alignment. Mapping software for Excel provides faster feedback and clearer insights, so you can make better decisions, quicker both internally and externally.
Use eSpatial to Map Excel
Data Quicker and Easier
eSpatial takes the manual work out of mapping Excel data, handling everything from street-level addresses to ZIP codes, ensuring your mapped data is accurate and ready to analyze. In just a few clicks you can generate a map from Excel, visualize complex datasets, identify patterns, and create shareable, presentation-ready maps. With a free trial and comprehensive support, you can go from spreadsheet to interactive map in just a few clicks, unlocking real business value.
Get Started With eSpatial Today
Our team is here to help you every step of the way

No credit card required
How to Start Excel Data Mapping
- Prepare your spreadsheet (.csv, .xls or .xlsx)
- Sign up for a free trial – no credit card needed
- Upload your file - select your prepared spreadsheet or add an existing dataset from the library
- Adjust settings - (e.g. country, labels, formatting)
- Map all your data at once – then style, export or share
If you need more help, follow our in-depth guide on preparing your data.
Frequently Asked Questions
How Do You Map Two Data Sets in Excel?
You can use functions like VLOOKUP or INDEX/MATCH to connect fields across two datasets. Once linked, you can analyze the combined data with filters or pivot tables. This reveals insights that wouldn’t otherwise be visible in isolation.
How is eSpatial Different From Excel’s Map Chart Feature?
Excel’s map charts offer basic visuals. eSpatial provides interactive, dynamic mapping. You can optimize routes, build territories, and analyze real-time patterns.
What Types of Excel Data Can I Map in eSpatial?
Any spreadsheet with location-based fields like addresses, ZIP codes, or coordinates can be mapped. You can use it for customer lists, sales data, and service calls. eSpatial helps turn all of it into location intelligence.

