A proximity map is more than just a static circle on a screen; it is an objective decision-engine for your field operations. By drawing perfect travel-time or distance radius maps around key sites, you can instantly count customers within a service territory, qualify high-value sales leads for reps on the go, and optimize local marketing events. Sashing driver windshield time by 20% begins with knowing exactly where your resources sit in relation to customer density.
Why Create Heat Maps From ZIP Codes? Go granular to grow
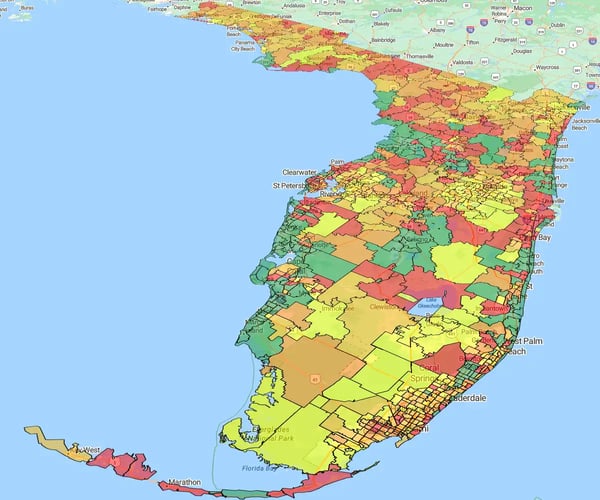
Rows and columns can’t show spatial patterns. ZIP code heat maps reveal the specific trends that flat data conceals. State and county views are too blunt for modern business. You need granularity to manage field teams, assets, and customers effectively. Precision unlocks revenue. By mapping at the ZIP code level, you spot expansion targets and performance gaps that broad maps miss.
A real-world example for marketing when creating a new campaign:

Don't Launch Blind
Powerful mapping software turns raw data into a clear campaign roadmap, exposing exactly where to attack. You can't optimize ROI if you can't see the battlefield. Heat maps reveal the specific ZIP codes where you are winning, losing, or missing out.
The Answers You Need
- Hunt for whitespace: Identify low-market-share areas ripe for growth
- Audit your spend: Instantly see where budget is wasted versus performing
- Plot expansion: Use sales hotspots—not gut instinct—to dictate your next move
Sales Ops: Optimize
Territories, Boost Revenue

Stop Wasting Drive Time
Imbalanced territories kill productivity. Visualizing your data reveals exactly where your reps are versus where they should be. Travel time eats selling time. If your reps aren't in "weighted centers", close to high-density customer clusters, you are losing money.
- Visualise reality: Layer rep locations over customer pin maps to see the gaps instantly
- Spot the imbalance: Use heat maps to expose coverage failures your spreadsheet missed
- Realign fast: Shift boundaries to ensure reps are hunting where the opportunities actually live
Retail: Location is Destiny

Success isn't about luck; it's about locating the right demographics. Mapping software reveals exactly where your buyers are before you sign a lease. A bad location is an expensive mistake. To build momentum, you need to visualize the patterns, income, age, and spending power, that spreadsheets conceal.
In Action
- Target precisely: A menswear retailer uses eSpatial heat maps to overlay customer demographics on ZIP codes
- Spot the fit: They instantly identify high-potential zones that match their buyer profile, removing the guesswork from site selection