
In our last article, we discussed how to create a sales strategy in 15 steps. An essential aspect of your business and sales strategy is competitor analysis. You uncover treasured insights into their strengths and weaknesses. You can identify opportunities to win in your chosen markets and some threats to your growth ambitions. And mapping software can pack a power punch when analyzing complex data.
Here, we outline the steps to analyze competitors in detail:
Firstly, define the markets, verticals, customer types and personas you will prioritize. That informs all other future analyses and decisions.

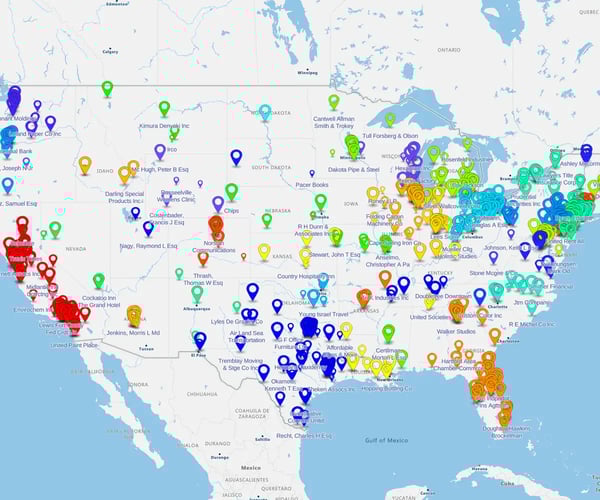
A color coded pin map is a great way to visualize customer locations, customer by industry and verticals.
Make an active list of your competitors by market or industry vertical. Focus on those with similar services and products to your own first.
Next, list those that offer indirect competition. For example, eSpatial has direct competitors who make and sell sales territory mapping software. But when we compete for a buyer's attention, we may compete with alternative solutions; for example, an organization can choose to invest in other sales productivity or effectiveness tools. They may opt out of choosing mapping software in preference to an alternative. What alternatives do your customers have to you?

It is a time-consuming process and should be ongoing. Desktop research is a great starting point, but involve your sales and marketing team and understand in greater detail
- The product offering
- The product features and capabilities
- Product Quality
- Pricing
- Delivery and service levels
- Value propositions
- Positioning (low-cost, high-service)
Use your research to identify potential gaps in your market and competitors' offerings you can exploit.
When you created your sales strategy, you identified target markets, industries, verticals and personas.
Now do the same for your competitors:
- What are their target markets?
- Do they focus on specific industries or verticals?
- Who are their target personas
- How have they tailored their offerings to their chosen personas?
- Where are their target customer locations?
- Are there niches they target?

What are your competitors go to market strategies? How do they market, promote and sell their products?
- Advertising
- Social media
- Conferences, events
- Content marketing
- Partnerships
- Promotional activities
- Pricing
- Channels (direct or indirect)
In a digital world, you must know your competitors' digital strategy. Start with their website, social media presence, business articles, eBooks and blogs. Get an understanding of how they interact with their customers and build trust. Assess how their target audience perceives them.
Check out their customer feedback and reviews and assess what customers love or dislike about them.
We highlighted pricing earlier in your research and GTM stages. You must understand their pricing model and positioning. How do they generate revenue? For example, through products, services, consultancy etc.
What are their winning value propositions in their chosen markets?
What are their strengths?
When they lose, and you win, what are the primary factors?
What differentiates them from you and others?
Where are they most vulnerable?
When are you most vulnerable when you go head-to-head with them?
How many salespeople do they employ in your target markets? What field resources?
What level of investment do they make in marketing relative to you?

Larger organizations are easier to assess as much of their financial information is publicly available. Read their annual reports, SEC filings or news articles. Assess their financial health and profitability.
As you progressed through the previous stages, you started to collect valuable insights on:
- Strengths
- Weaknesses
- Opportunities
- Threats
Formalize your insights with a SWOT analysis and use it to identify ways to out-compete. Refine your competitive advantage by focusing on differentiating your products, services and value propositions to stand out in a crowded marketplace.
Armed with the best competitor intelligence you can discover, you can commit your winning proposition to paper and bring it to your marketplace. And win.
Markets are dynamic and uncertain; competitors never stand still, so neither can you. Continuously monitor your competition. Interview customers regularly to understand how they view the competitive landscape and how you fit into their worldview. Collaborate with your field-based teams and marketing to develop systems and processes for capturing, analyzing and making sense of the feedback.