• Route optimization

Drive Time Analysis: Optimize Your Ops

Liam Costello
  • Published: February 27, 2024
  • Updated: November 21, 2025
  • Author: Liam Costello
  • Reading time: 10 mins

Quick answer

Drive time analysis uses GIS to calculate real-world travel time, factoring in traffic and speed limits instead of just physical distance.

It proves that "close" doesn't always mean "accessible." This allows businesses to base decisions on actual commute realities rather than straight-line geography.

The impact:

  • Visualize access: Creates clear zones showing exactly who can reach you (and how long it takes).

  • Pick prime sites: Identifies optimal sales or retail locations based on actual customer drive times.

  • Speed up logistics: Optimizes supply chains to cut delivery costs and transit time.

  • Assess value: Evaluates real estate potential based on true commuter accessibility.

The first question for any sales trip: "How soon will I arrive?"

Drive time analysis software answers this by analyzing precise commute times and logistics.

Efficient routing executes your business model faster and satisfies client needs.

This guide covers the definition, use cases, and how to leverage the tool to stay ahead.

What is a Drive Time Analysis?


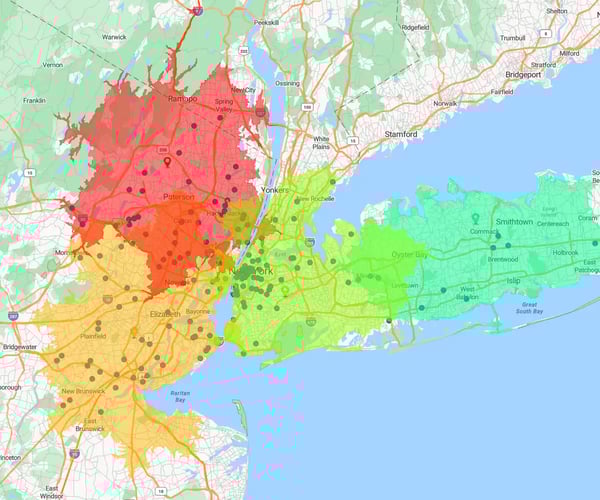
Drive time analysis uses geographic information system (GIS) tools to calculate the time-based distance between points.

How it works: It processes spatial data—accounting for speed limits, traffic, and road conditions—to visualize accessible "drive time zones" on a map.

It reveals true accessibility. Instead of guessing travel times, you get data-driven insight into how long it actually takes to navigate physical obstacles and congestion.

Drive time analysis of Washington

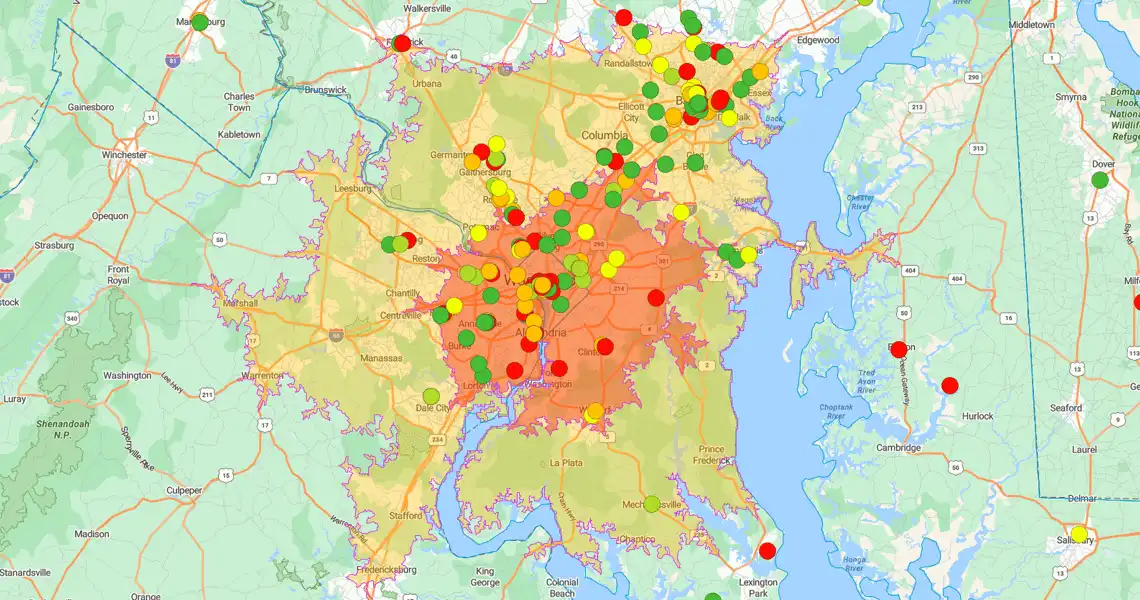
30 minute drive time buffer highlighted in red

60 minute drive time buffer highlighted in yellow

Drive time analysis of Washington

In action: Planning a product launch?

  • The Goal: Boost attendance.

  • The Fix: Use drive time analysis to target only clients within a one-hour drive.

  • The Result: You ensure the venue is convenient, increasing the likelihood of guests showing up.


What is Drive Time Analysis Used For?


Drive time analysis optimizes delivery routes, distribution networks, and transportation costs. Here is how to use it to improve operations:

1. Pinpoint sales locations

Retailers use drive time maps to spot coverage gaps and optimize store placement.

  • Real-world win: A pharmacy chain analyzed their data and found 95% of customers lived within a 30-minute drive.

  • The payoff: They stopped advertising in the 60-minute radius and focused spend on the 30-minute zone, cutting marketing costs by 40%.


2. Analyze market reach

Stop guessing how far people will travel. Drive time maps visualize exactly which campaign audiences are accessible from a specific spot.

  • In action: If you are planning a product launch, you can filter for venues where the highest density of customers are within a 30-minute drive.

  • This maximizes attendance and aligns your event strategy with actual customer travel tolerance.

3. Optimize supply chains

Route optimization isn't just about miles; it's about minutes. Drive time analysis identifies the most time-effective routes to eliminate supply chain bottlenecks.

Real-world application: Global logistics firms use this data to sell speed.

  • The Challenge: A shipping company wants to guarantee customers a 30-minute delivery window.

  • The Solution: Instead of guessing, they use drive time analysis to locate a distribution center where that 30-minute radius is physically possible, accounting for traffic patterns.

  • The Result: Operations are streamlined, transit times are minimized, and the customer promise is kept.


4. Assess property value

Real estate investors use drive time maps to value homes based on real-world commute times to office hubs and amenities.

Instead of guessing, you can filter searches to "all properties within a 15-minute drive" of a workplace to identify high-demand targets.


5. Slash delivery times

Drive time analysis finds the fastest path, not just the shortest distance.

Speed builds trust. Beyond operational efficiency, consistently shorter delivery windows drive:

  • Customer loyalty

  • Higher conversion rates

  • Competitive advantage

6. Master Your Schedule

Stop guessing travel times. Drive time maps use real-time traffic data to calculate the exact minutes between appointments.

You can steer clear of congestion zones before you leave.

Pro tip: Use the data to build smart buffer times—eliminating the stress of missed deadlines or late arrivals.

How to Use eSpatial


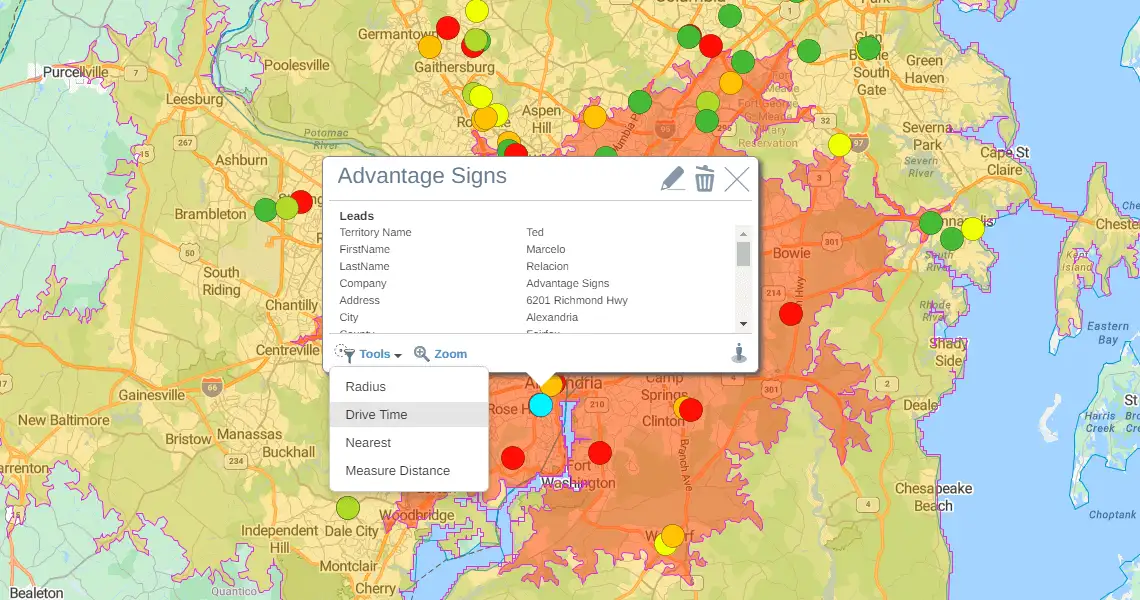
Creating a drive time analysis takes seconds. Start with your central hub (like an office or warehouse), then:

  1. Click "Drive Time" in the Analyze window.

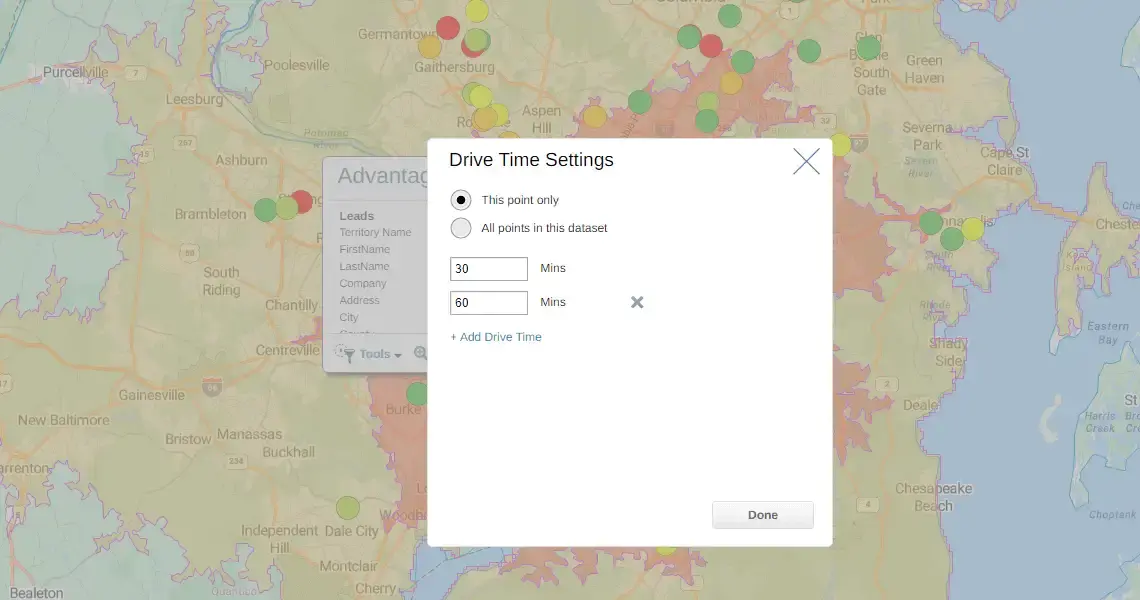
  2. Select your target from the "Find" dropdown and set your time limit (up to 120 minutes).

  3. Choose your central point and configure your table columns (units, distances).

  4. Watch it work: The tool instantly layers the analysis onto your map for further editing.


Gain the Drive Time Advantage


Drive time analysis turns location data into actionable insights on market reach and customer behavior.

Why eSpatial: Our radius maps provide the deep analysis needed to optimize logistics, target marketing, and expand strategically—without the guesswork.

Stop estimating and start analyzing.


Frequently Asked Questions


Q: Why Use eSpatial Instead of Google Maps?

Google Maps navigates. eSpatial analyzes.

The big difference: Free tools handle one route at a time (getting from A to B). We analyze your entire network at once to uncover strategic insights.

Why it matters: You move beyond simple driving directions to get data-driven answers to critical business questions:

  • "Which accounts are within 30 minutes of my best rep?"

  • "Where is the perfect spot for a new hub to minimize total team travel?"

Q: Why Not Just Use Our Bi Tool's Map?

BI maps show you "where." Drive time analysis shows you "how."

BI tools excel at high-level dashboards, but they lack the engine for operational planning. You see dots; you don't see the drive.

Why eSpatial wins: We turn static data into actionable logistics.

  • Model reality: Create multi-point scenarios to see the real-world impact on travel.

  • Plan precise days: Identify exactly which customers a rep can realistically visit in one shift.

The bottom line: Don't just visualize your data. Act on it to boost efficiency and sales.

Q: How Do I Fairly Reassign a Departing Rep's Accounts?

Manual reassignment creates uneven workloads and territory gaps.

The fix: Use drive time analysis to instantly visualize which existing rep is within a realistic drive of each orphaned account.

Data-driven transitions prevent burnout and lost revenue.

  • Balance the load: Assign based on actual travel time, not gut feeling.

  • Keep the customer: Ensure every account stays within a serviceable range during the handover.

Q: How Do I Stop Technician Burnout and Balance Workloads?

Forget straight-line distance. Traditional mapping ignores traffic, leading to impossible schedules.

The fix: Create service zones based on actual drive time.

By visualizing exactly who a tech can reach in a specific timeframe, you can:

  • Balance territories fairly.

  • Slash windshield time.

  • Boost satisfaction for both staff and customers.

Will Implementation Tie up My It Team?

Minutes, not months. Our platform is built for business users, not developers.

How it works:

  • Sync instantly: Connect seamlessly to Salesforce.

  • Drag and drop: Upload spreadsheets directly.

The result: You get instant mapping and analysis without writing a single line of code.

Q: Will the Team Actually Use It?

Zero training required. eSpatial is designed to be as intuitive as the consumer mapping apps your team uses every day.

Why they will adopt it: It makes their lives easier immediately.

  • Fast wins: They can visualize territories and plan weeks in minutes.

  • The incentive: They see the payoff instantly—less time driving, more time selling.

Q: How Do I Prove ROI to My Vp?

It's simple math: Every hour of drive time eliminated is an hour of selling time gained.

The Business Case:

  • The Goal: Reduce weekly drive time (avg. 10 hours) by just 20%.

  • The Gain: You unlock 2 extra selling hours per rep, per week.

  • The Scale: For a team of 20, that is 40 extra hours of face-time with customers every week.

The bottom line: It’s not a mapping tool; it’s a revenue engine.

Q: Where Are the Hard Numbers for Finance?

The ROI lies in efficiency. Optimized territories don't just save time; they cut hard costs.

Where you save:

  • Slash Fleet Costs: Optimized routes directly reduce mileage, fuel consumption, and vehicle maintenance.

  • Stop Turnover: Balanced workloads prevent burnout. Retaining one rep saves thousands in recruitment and lost productivity.

The bottom line: eSpatial provides the data to validate these operational savings before you spend.

Ready to propel your business forward? Incorporate our cutting-edge territory mapping software into your operations today!

You appear to be offline at the moment, this notice will disappear once your device can connect to the internet again