Create a pin map with your Excel data

Try for free

What is a pin map?

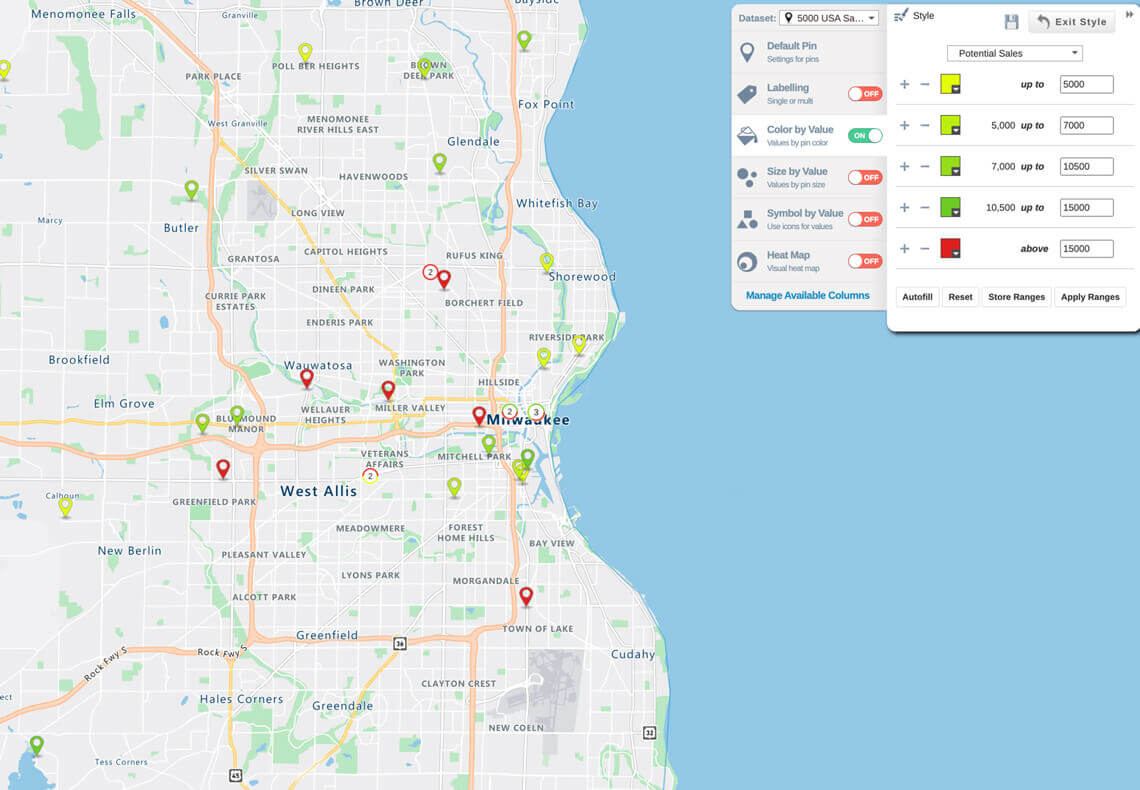
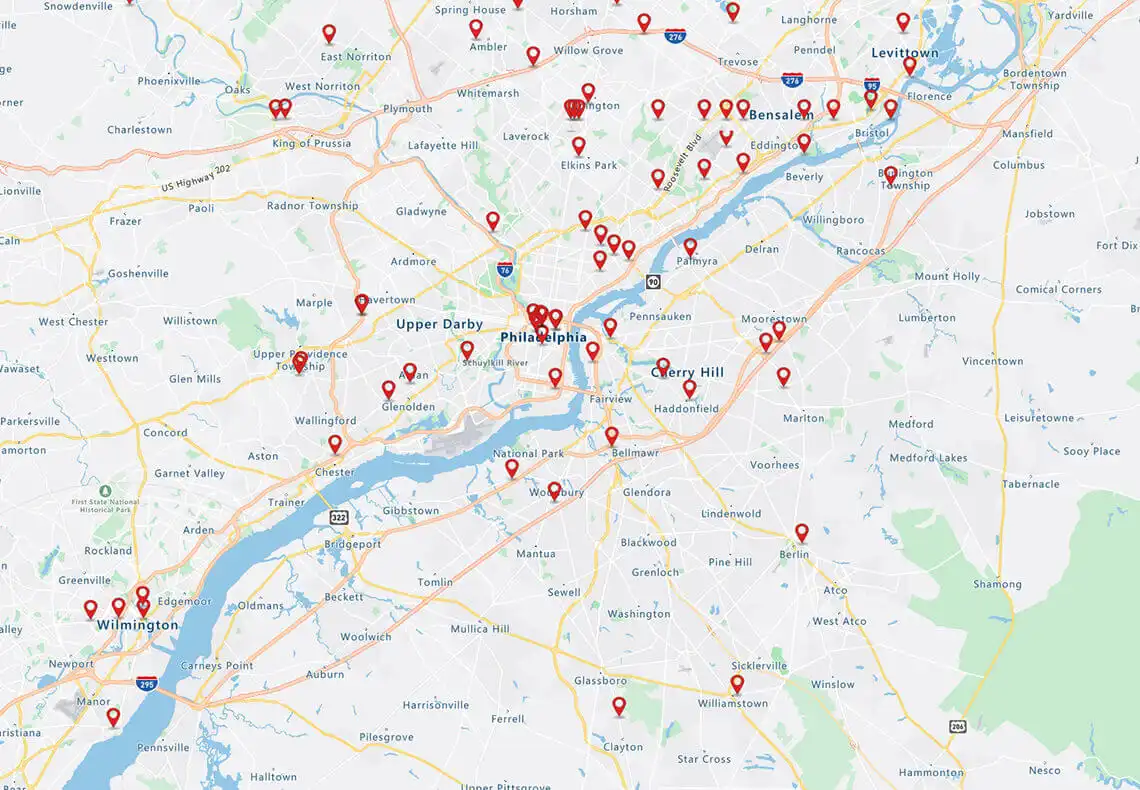
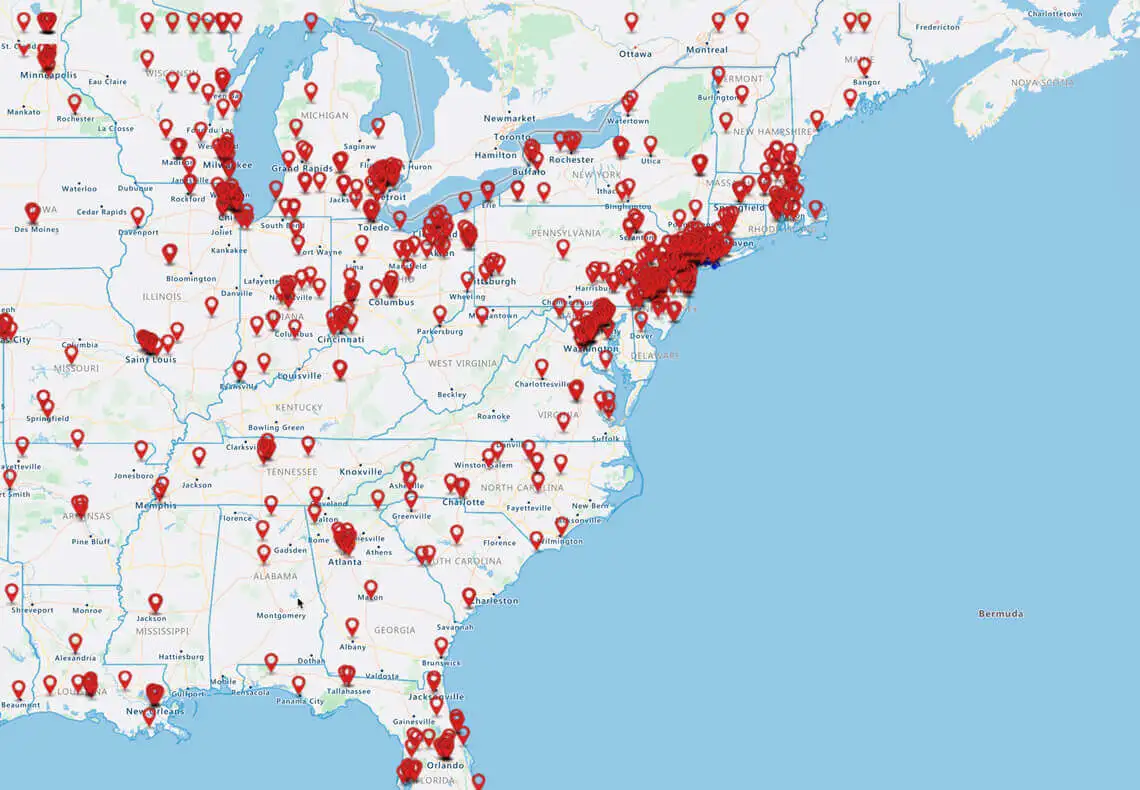
A pin map is the simplest way to express data on a map. It plots a pin wherever there is a geographic location contained in your data, as defined by ZIP code, street, state, country or county. It's not much different from the sort of push pin map made of cork board that you still see on the wall in some offices.

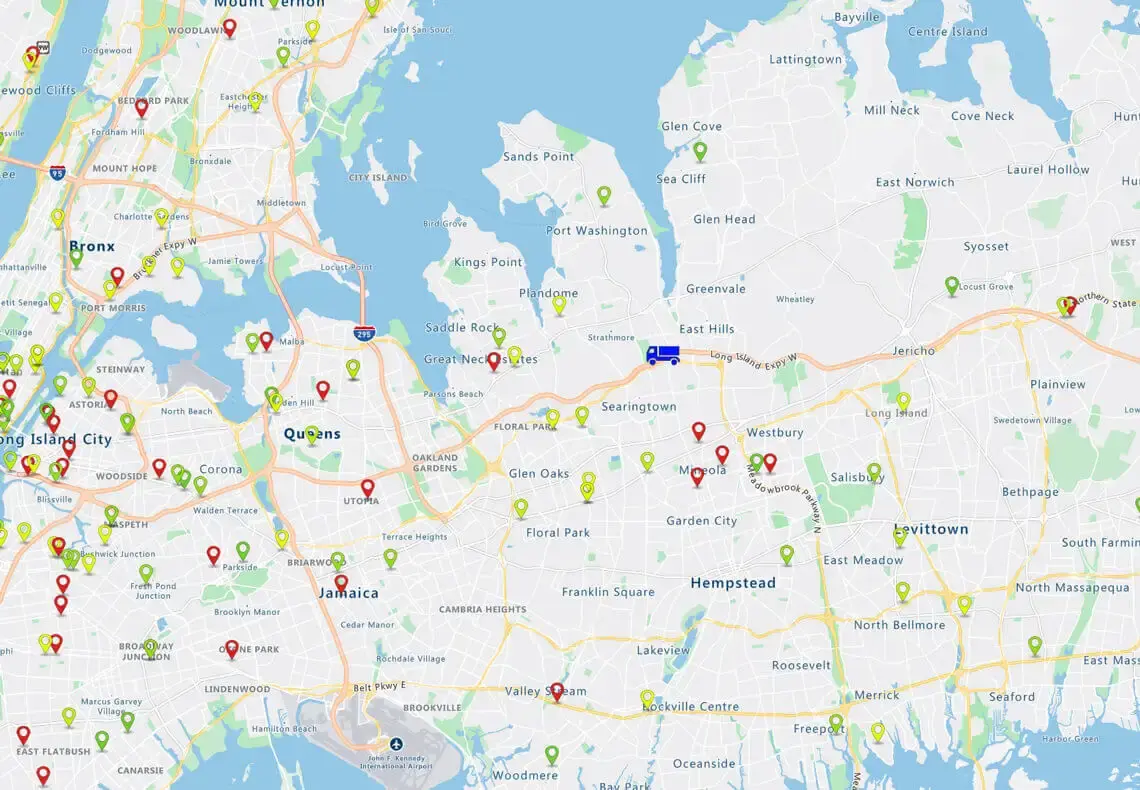
To create pin maps within eSpatial, all you need is an Excel spreadsheet that includes location data. Once you've put this visualization together, the mapping tool's array of features allows users to analyze or further enrich it. Field sales reps, for example, can use this map type as a travel map to plan their routes more efficiently.

Pin huge amounts of data

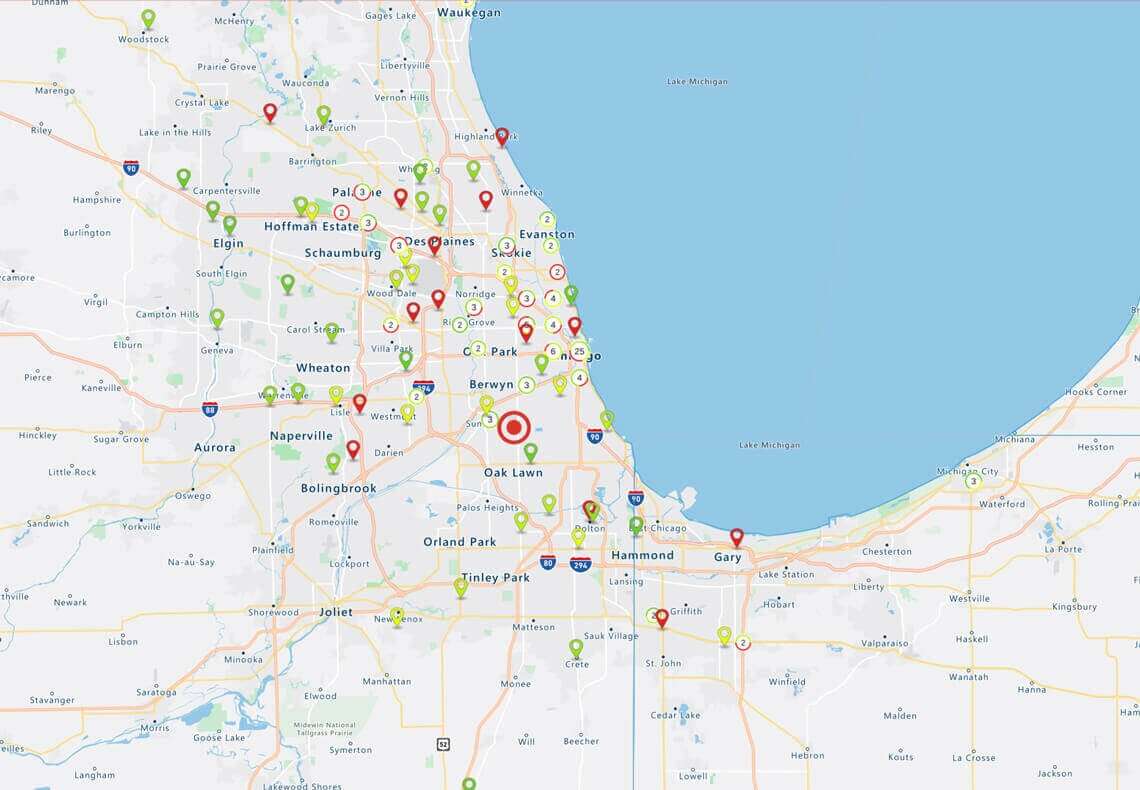
A pin map allows you to plot huge amounts of data to a single map. From there you can summarize and group pins according to geographic region. For instance, if you have 10 locations pinned in one city, then this will be summarized on the map by a number (e.g. 10). This is a useful shorthand feature when you are dealing with massive amounts of data spread throughout a region.

Compare and contrast layers of data

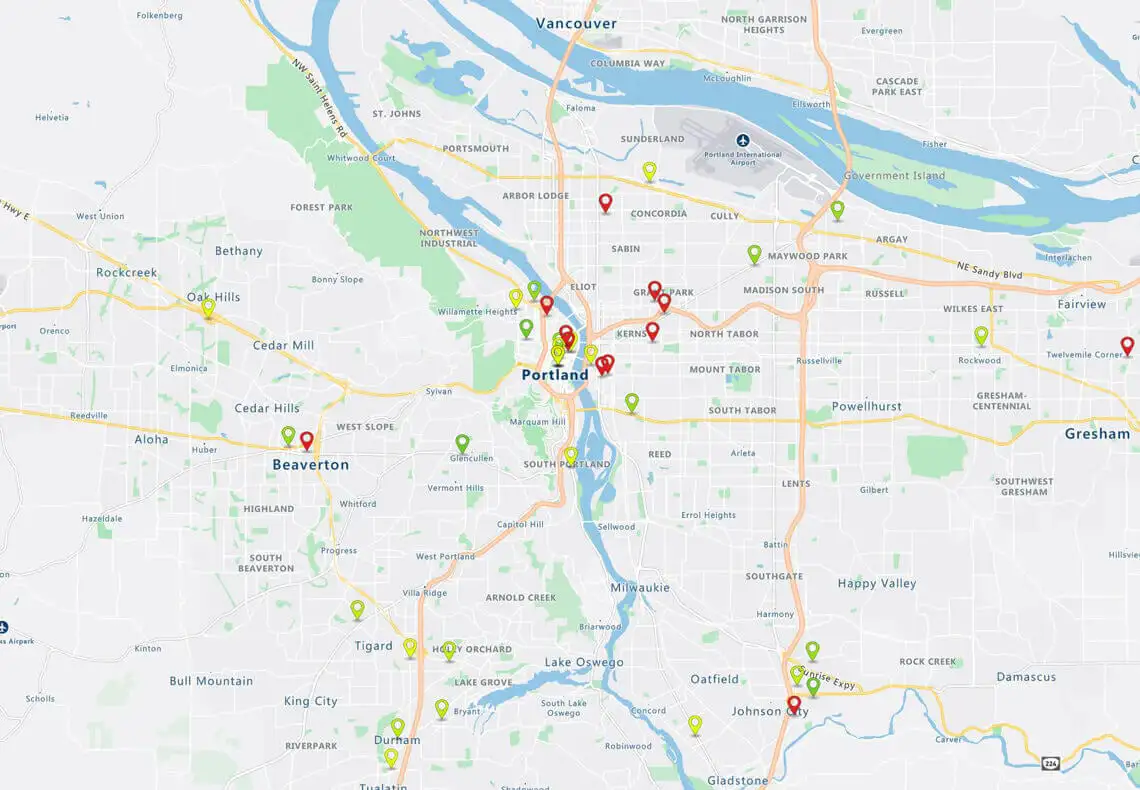
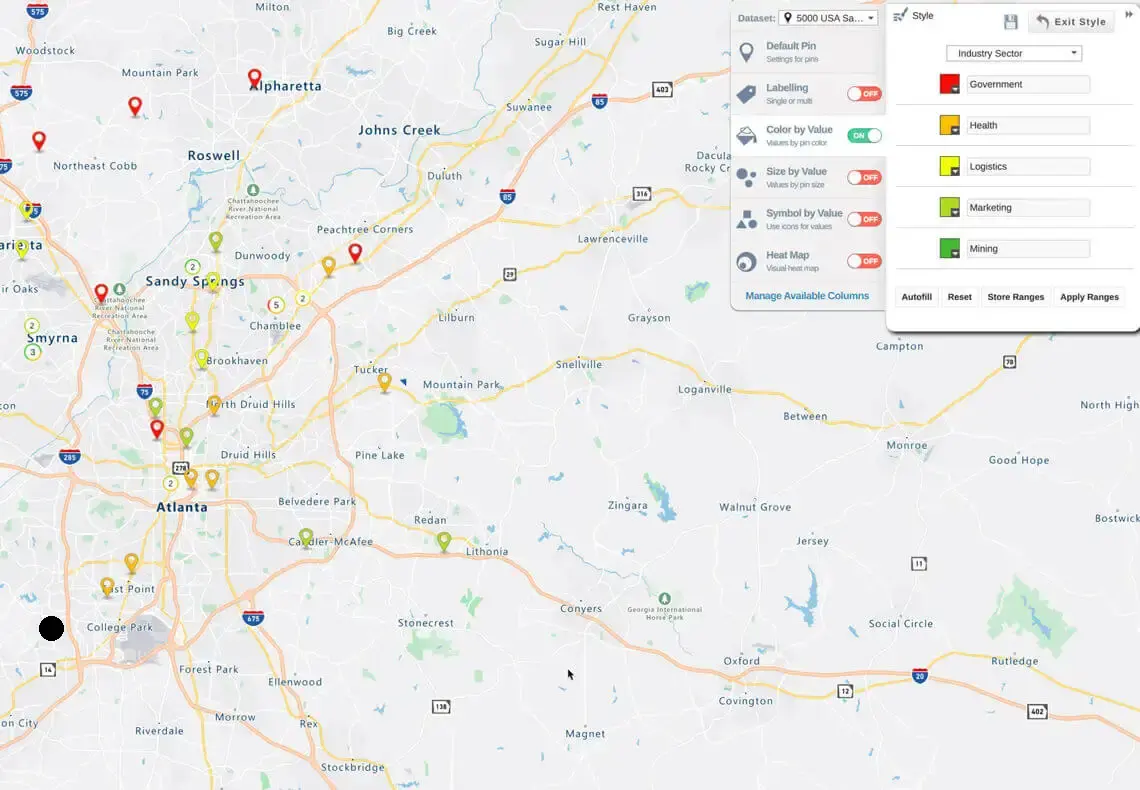
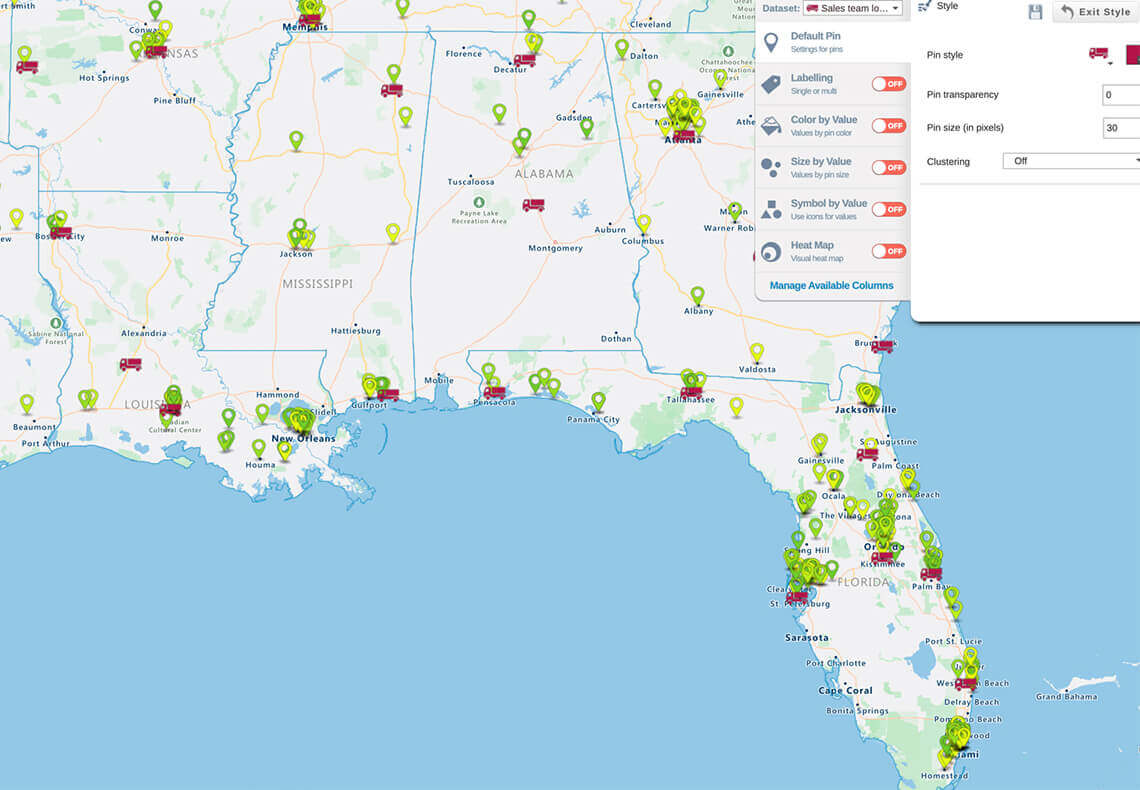
You can create complex visualizations that reveal the different levels of data that impact your business. For instance, if you were a distribution company, you could create a three-layer pin map revealing the location of customers, sales personnel, and warehouses. Each type of data point would be expressed using a different color. Layers can be switched on or off, as required.

Pack your pins with rich spreadsheet data & links

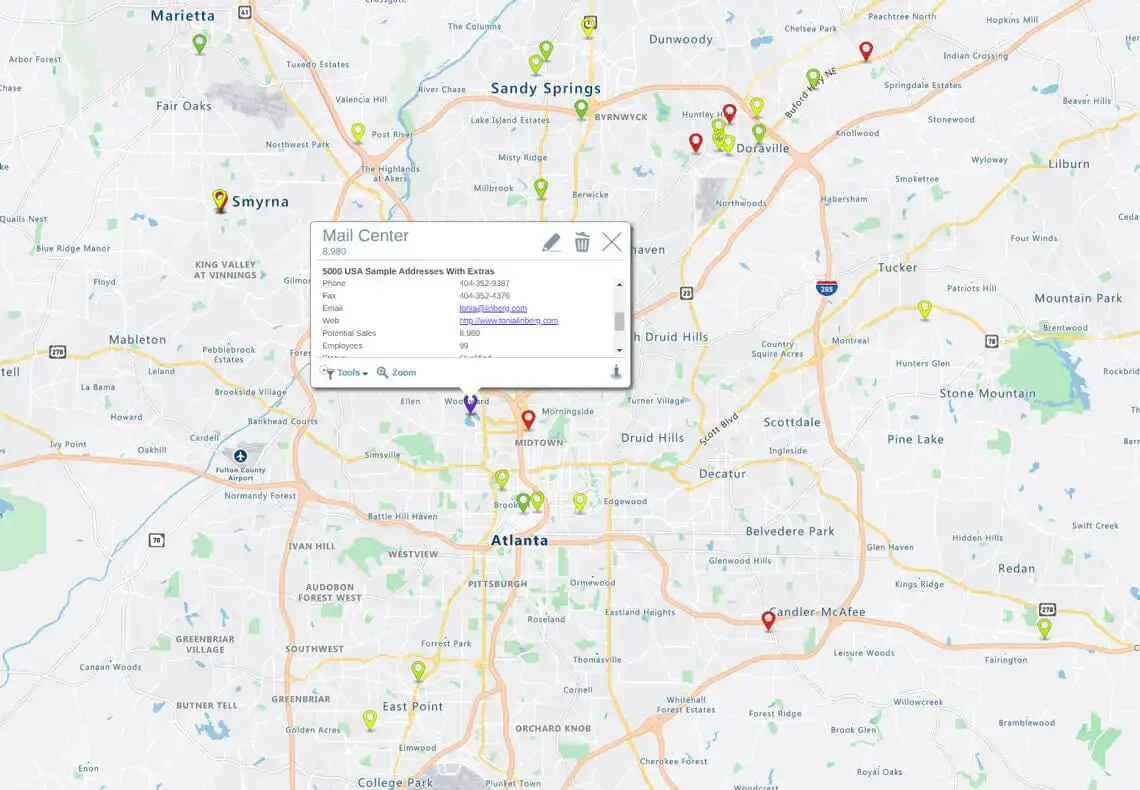
Each map pin contains the relevant data from each row of your spreadsheet. Looking over a map is a faster and more intuitive process for absorbing information than simply reading a spreadsheet. You can also link to web pages or CRM pages within the text box assigned to each pin icon, as long as you included that information in your original upload.

Filter your pin map

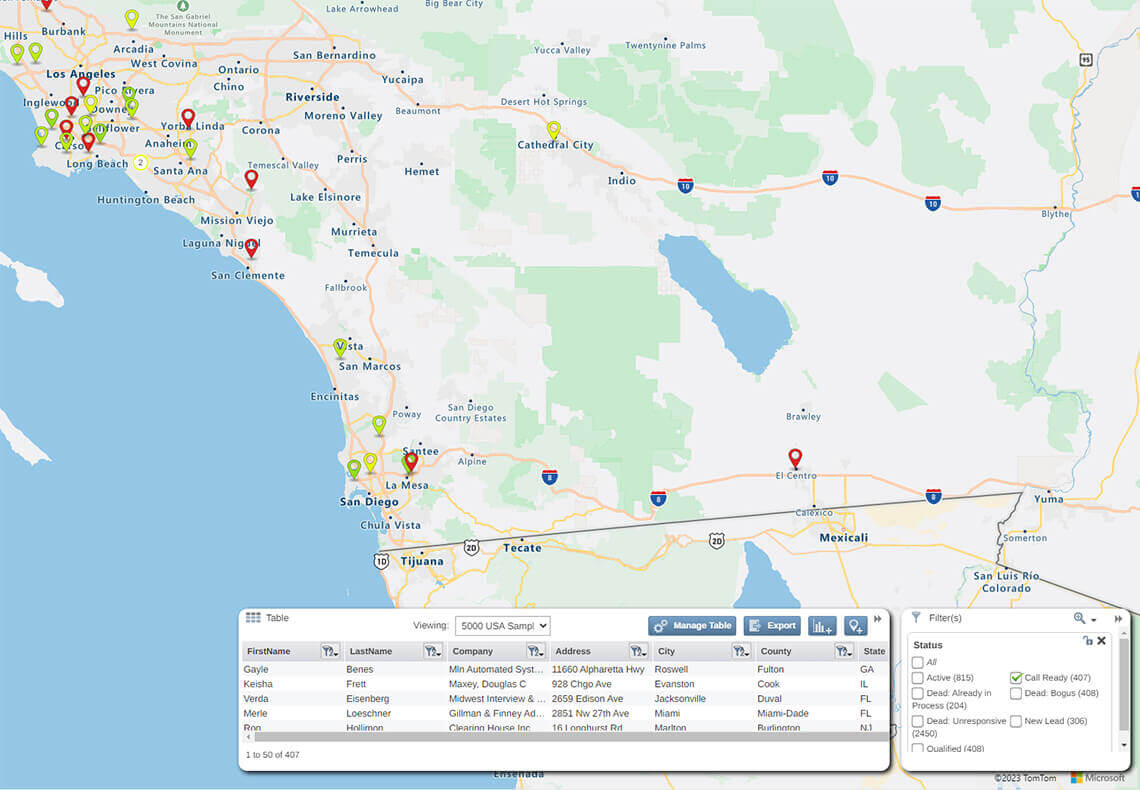
Pin maps made in eSpatial will be useful in their default states, but sometimes it can be more interesting to examine a smaller amount of data. Filters give you the option to view only a particular group of pins. This might symbolize all of the customers your team has visited in the past year, or all those who haven't paid you in the last six months. You choose the detail, and the filtered pin map will make it a visual reality.

Choose different styles of pin or make your own

Why settle for basic pins? With eSpatial, you can use different icons to express different data on a pin map. You can also signify volume with the actual size of the pin on the map: large for large volumes, vice versa for the opposite. You can also have your logo – or another relevant graphic – attached to map pins.

Publish and share your pin map

Like so many things in life, pin maps are better when shared. Using eSpatial, you can publish or embed a live version of each map you make. Not only can you update the uploaded data as needed, but other users can also zoom in or out and move around the map to their heart's content. It's just as easy as using a Google map on your phone, or looking at a world travel map pinned to the wall! Alternatively, you can export it as a flat image for a printout, or embed it within a spreadsheet.

Create your own pin map now

Sign up for a free 7-day trial

Create your pin map by following these 3 simple steps

1. Prepare your data

Save your data to a CSV file. Make sure that your columns have different category headings that specify different types of location information.

Prepare your data

Your next step is to register for a free trial. You’ll need to provide your business email address and create a password to use the software, but no credit card information is necessary. This will begin your free trial where you can create your map right away.

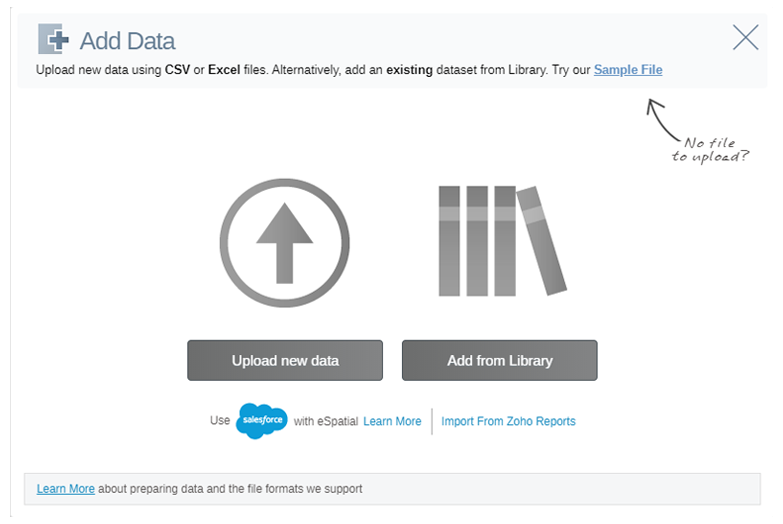
Log into eSpatial, then click the Upload new data option in the toolbar and follow the instructions that appear. (If you have any difficulties, you can get help from mapping experts in real time via our live chat system.)

Upload your data

eSpatial Pin Map

As soon as your data is uploaded, it will be plotted on a pin map as seen in the example above. Each marker on the map represents a row in your spreadsheet, and all of this data is contained within the text box that appears whenever a pin is clicked. From here, you can style your map, run various analyses or share it with team members.


Watch this video to see a pin map being created


My pin map is created, what can I do next?

Pin maps are only the beginning. With eSpatial, there are many ways to make maps that are incredibly valuable for your business:

  • Regional heat map – Turn your pin map into a regional heat map to see what states or areas have the highest density of pins, or have the greatest value in some other way. Learn more about regional heat maps.
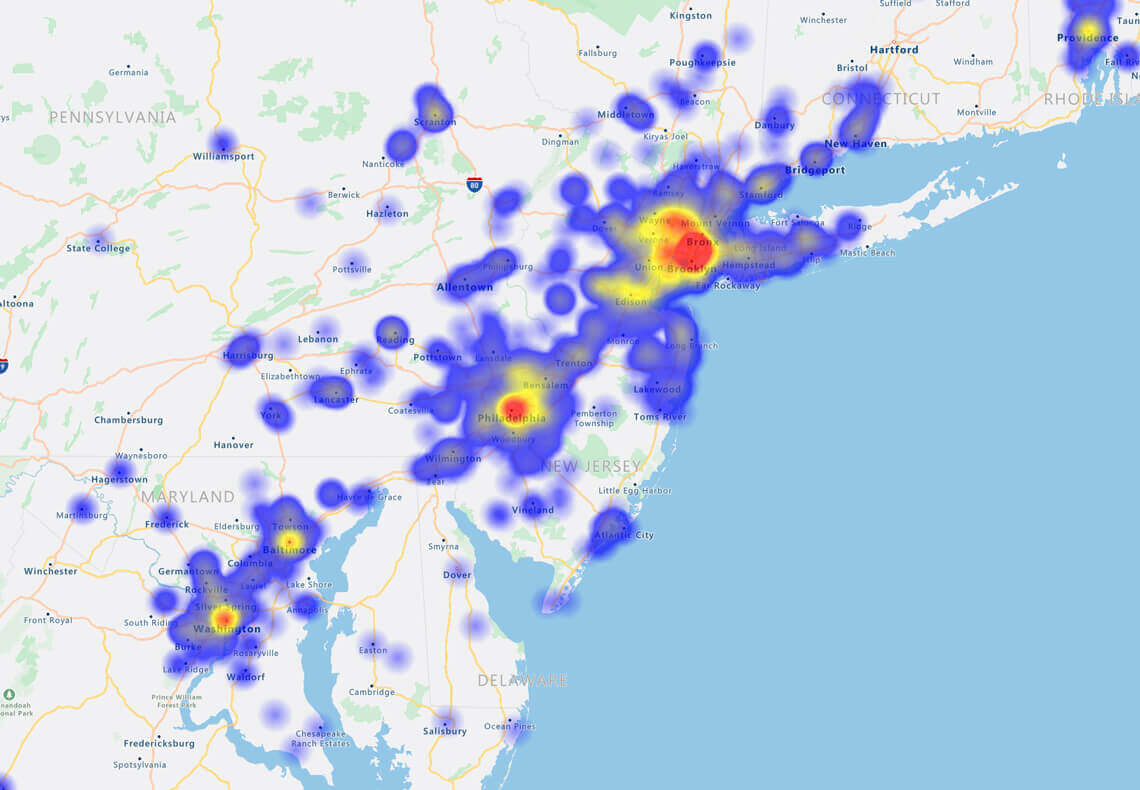
  • Hotspot heat map – Why not use hot spots to understand the density of pins? This can help you get a feel for where things are really happening for your business.
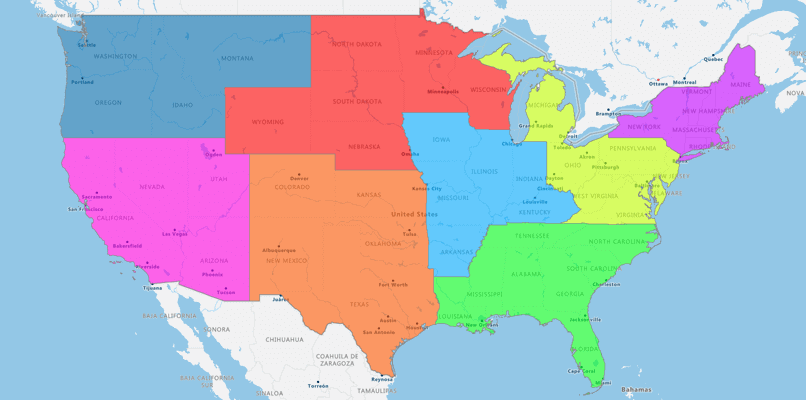
  • Territory map – Your map shows you what's happening across the nation. But what if you also want to break out who is responsible for the different areas? This is where territory maps come in handy. Learn more about territory maps.
  • Route map – Want to plan a route between your various pins? Route mapping can help you to optimize your travel by distance or time. This is often used by sales and services teams to make sure they aren't wasting time. It can also be used alongside a filter to make sure they're spending time with the right customers to maximize profit.