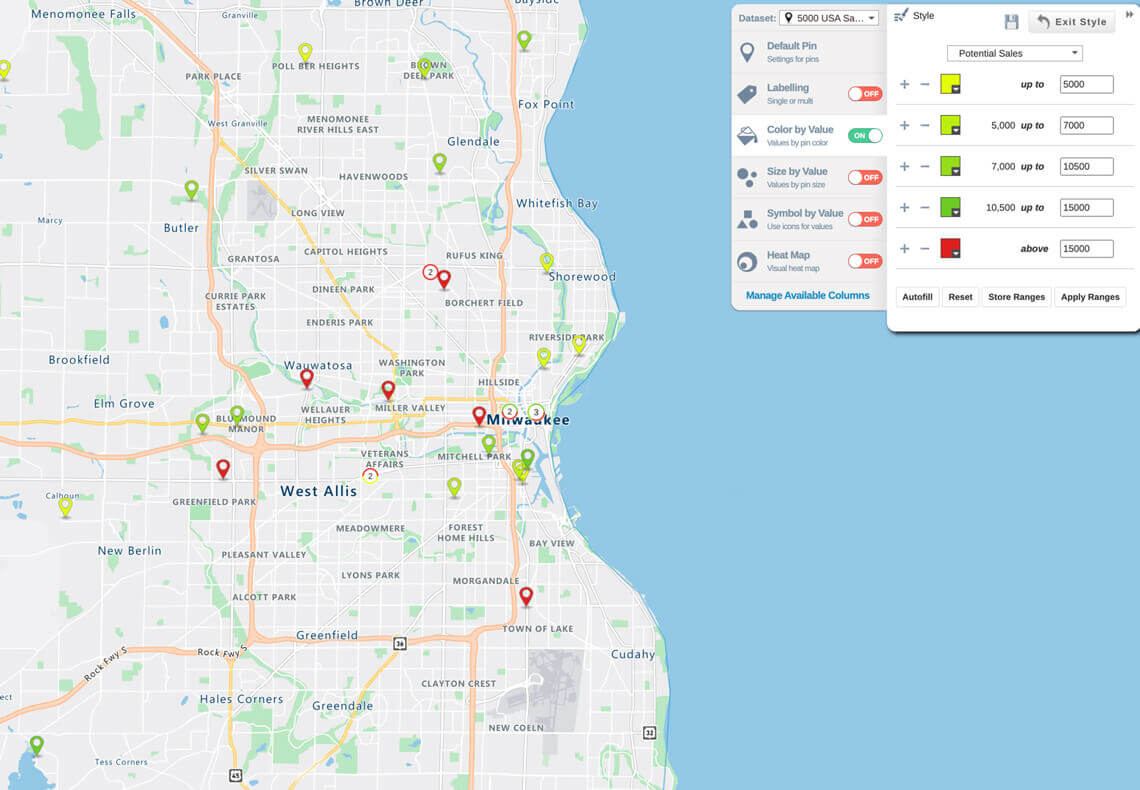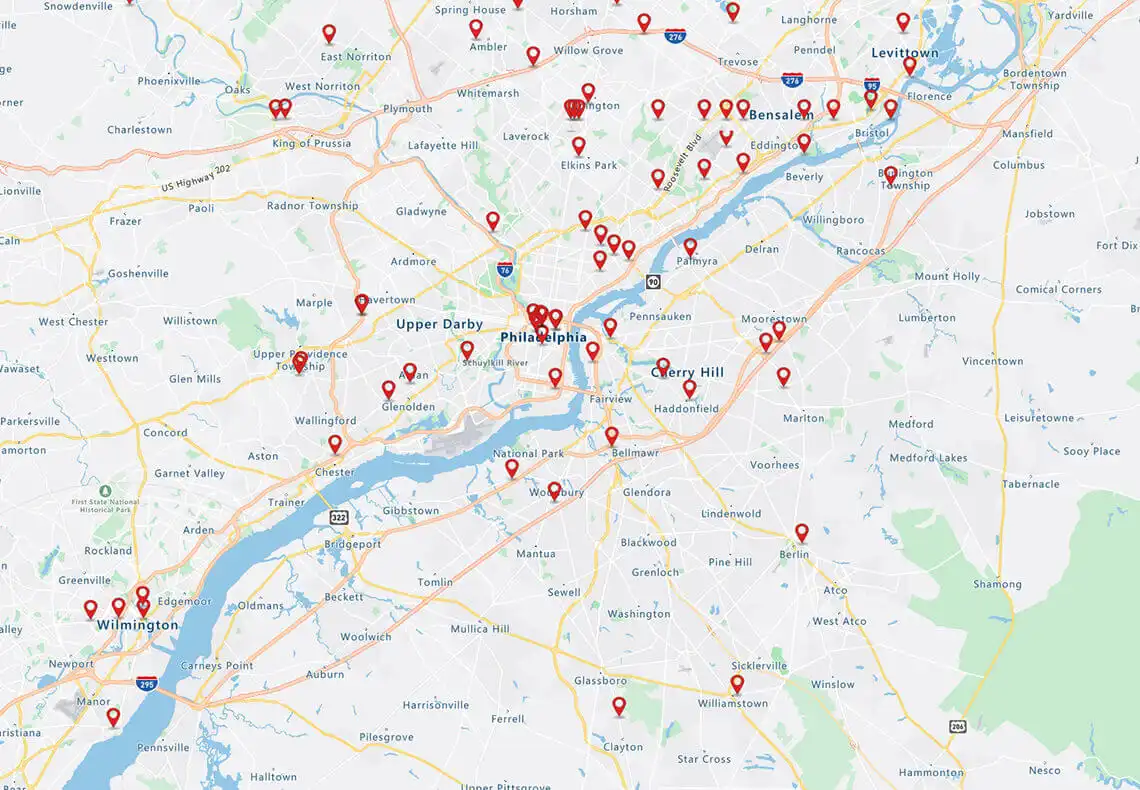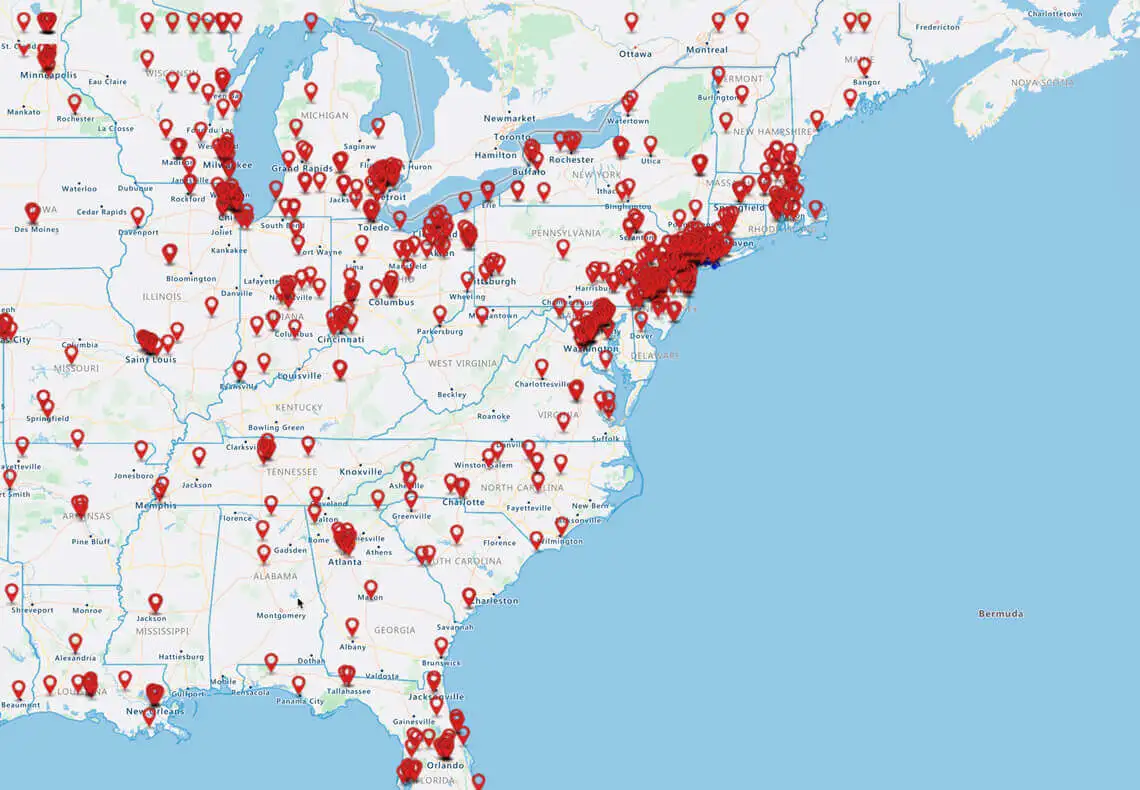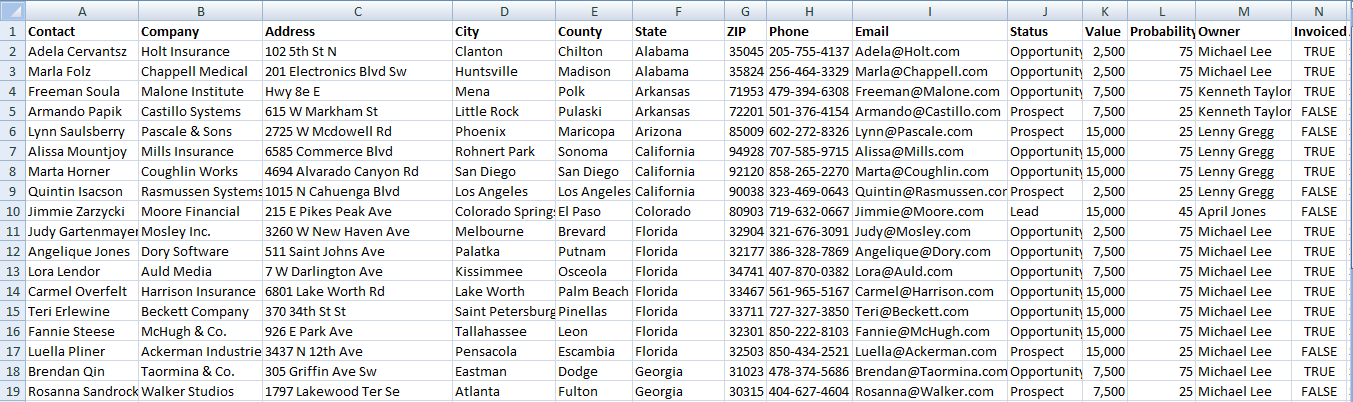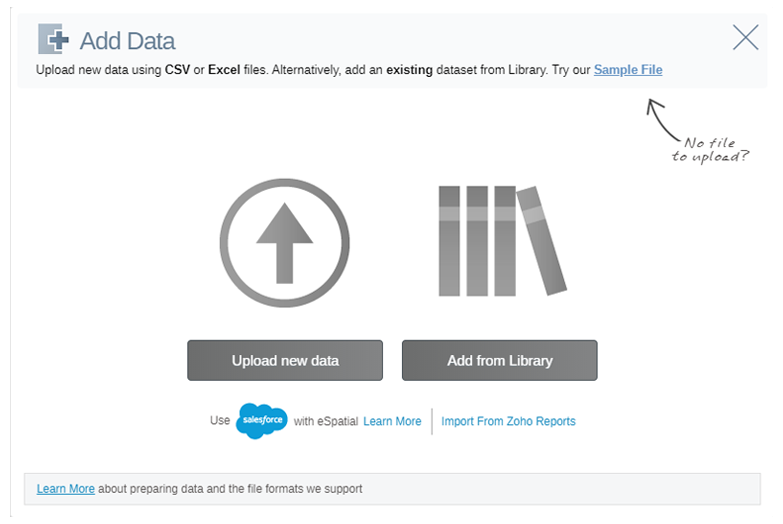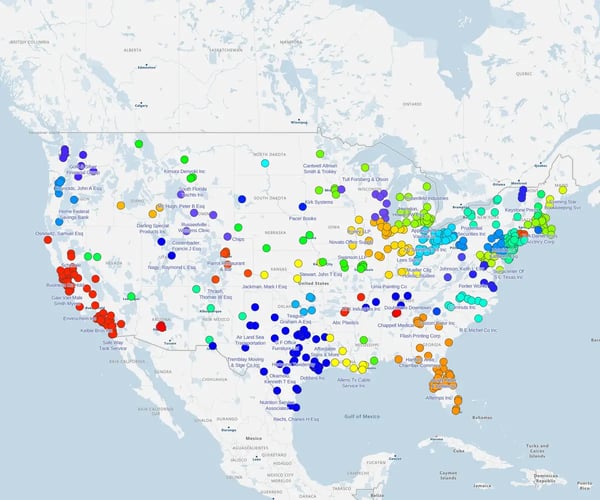
Creating a pin map from Excel is easy. Just take your spreadsheet, import it into eSpatial. The system will automatically take all of your data and plot it on a map.
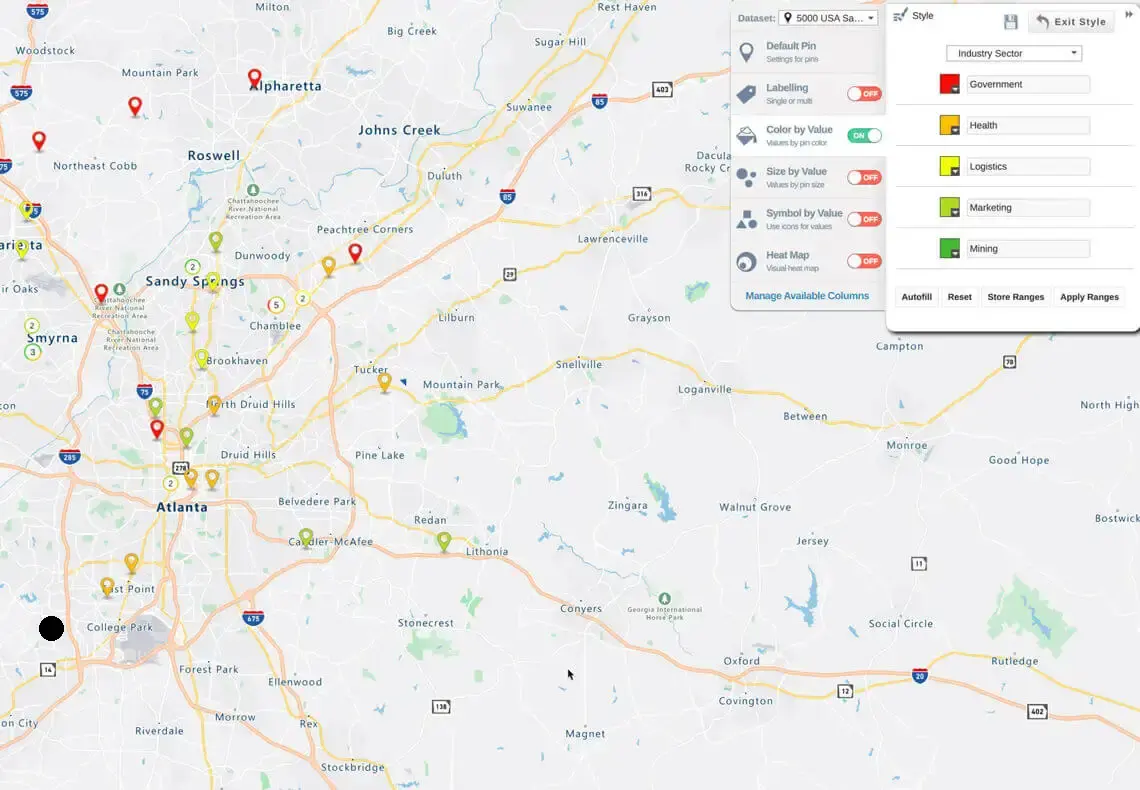
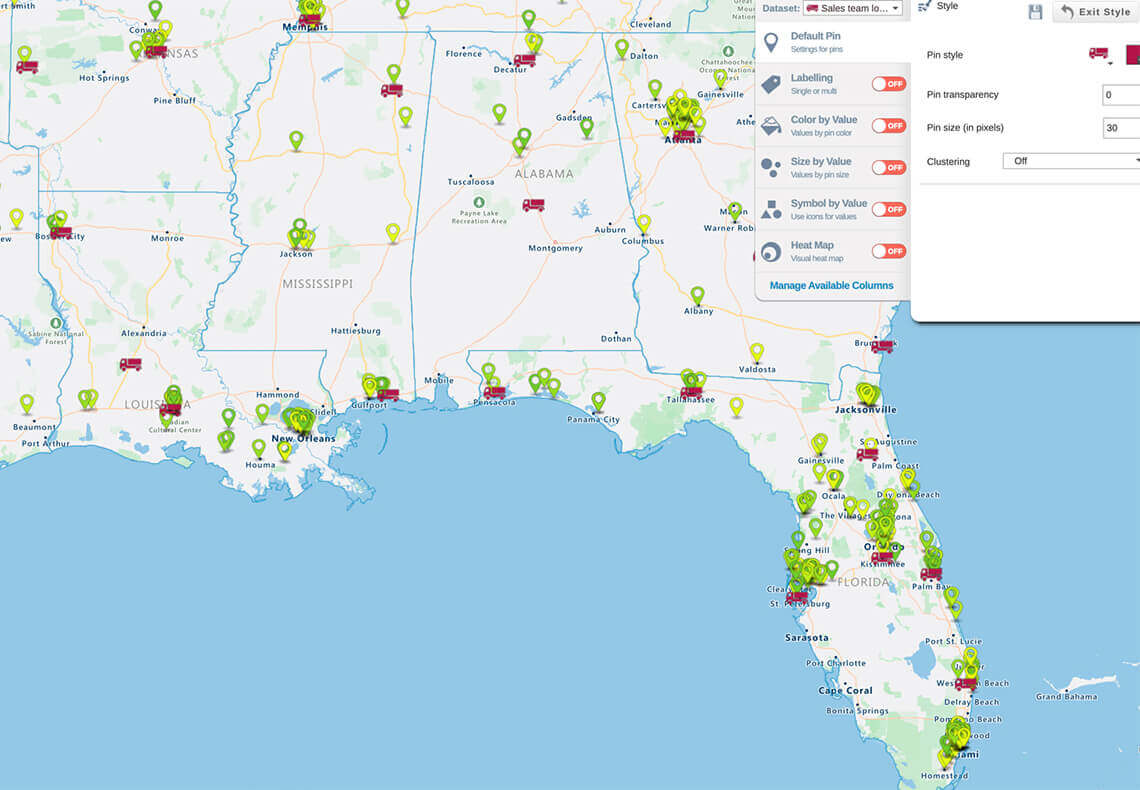
And if you want to style it, change the colors of the pins, or the size of the pins, you can easily do that here on the right-hand side.
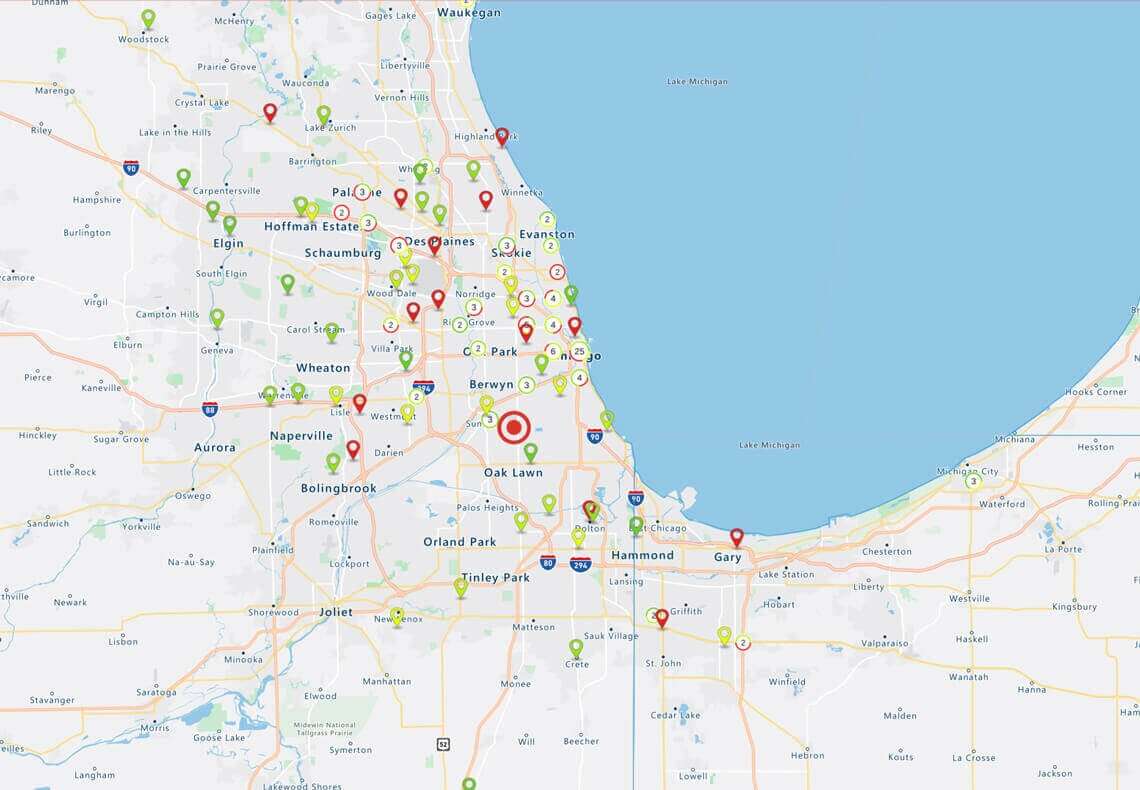
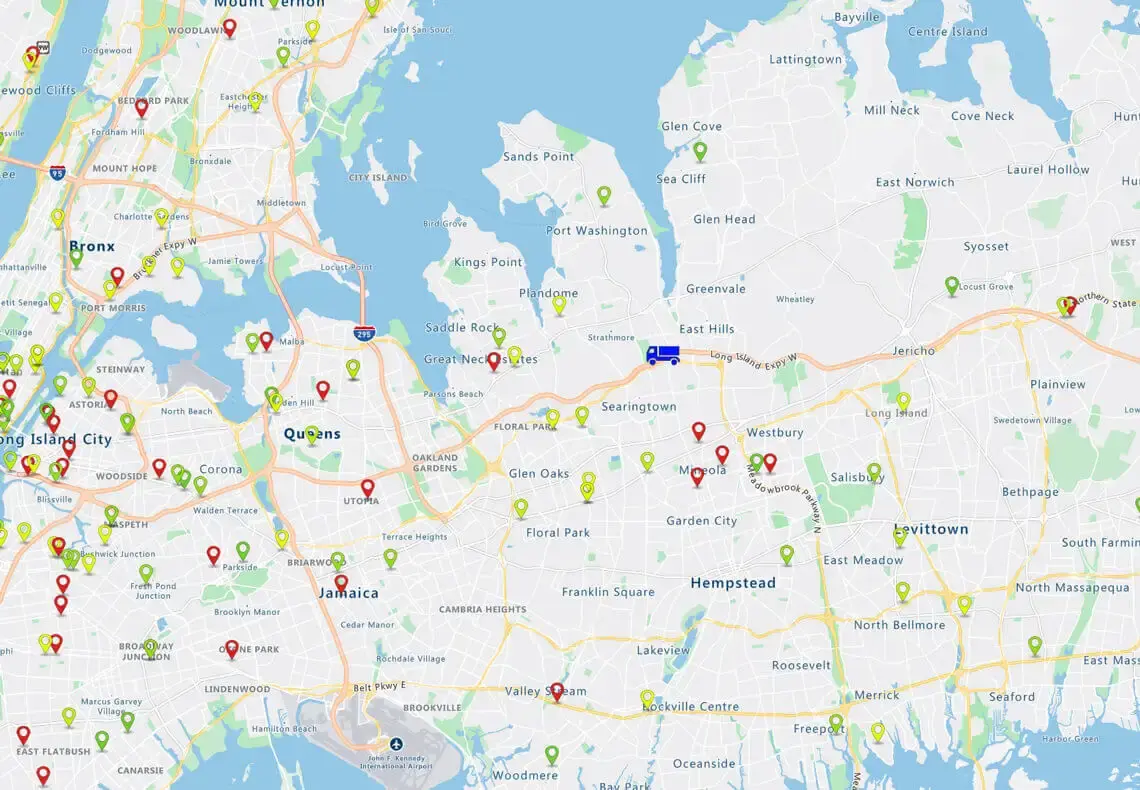
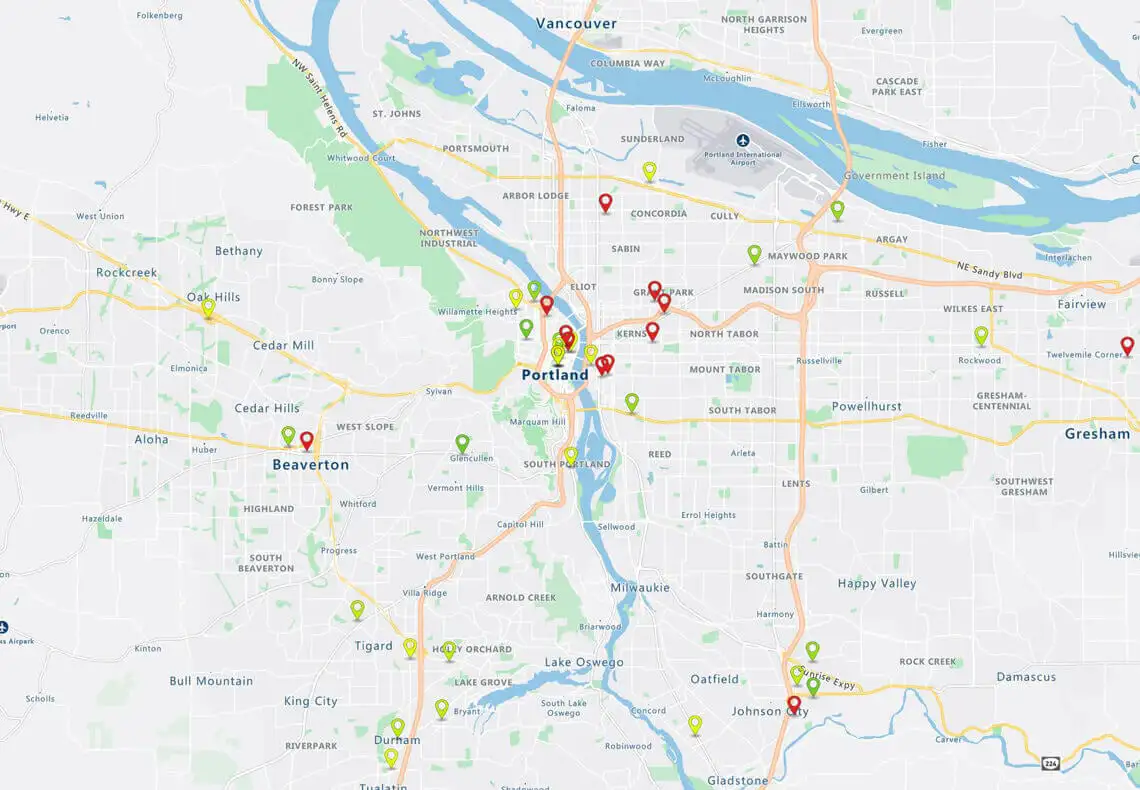
And there's your pin map.