
Clearly understanding customer and prospect locations, behaviors, and preferences for operations, sales, and marketing teams is crucial in driving better engagement and results. Choropleth maps offer an insightful visualization tool to uncover hard-to-see patterns and reveal untapped opportunities from quantitative data.
This post will define choropleth maps, explore what kinds of data they can display, and discuss their pros and cons for sales and marketing use cases.
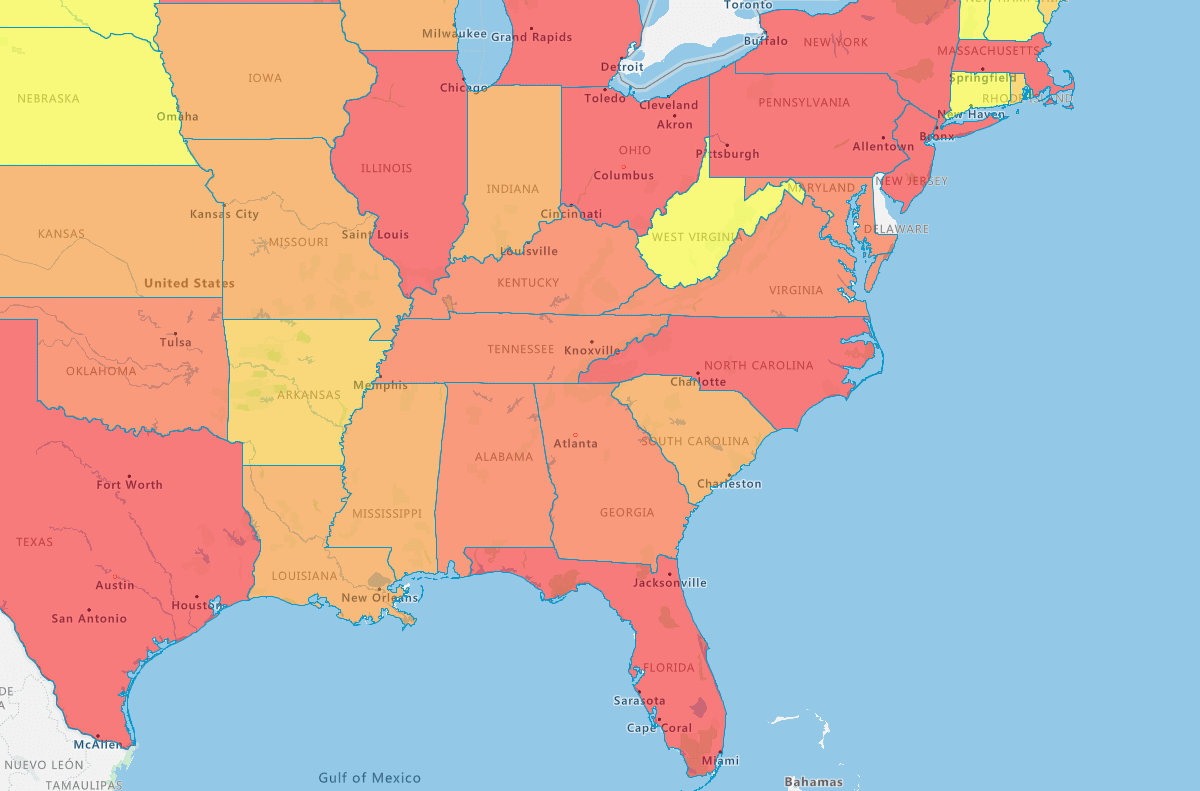
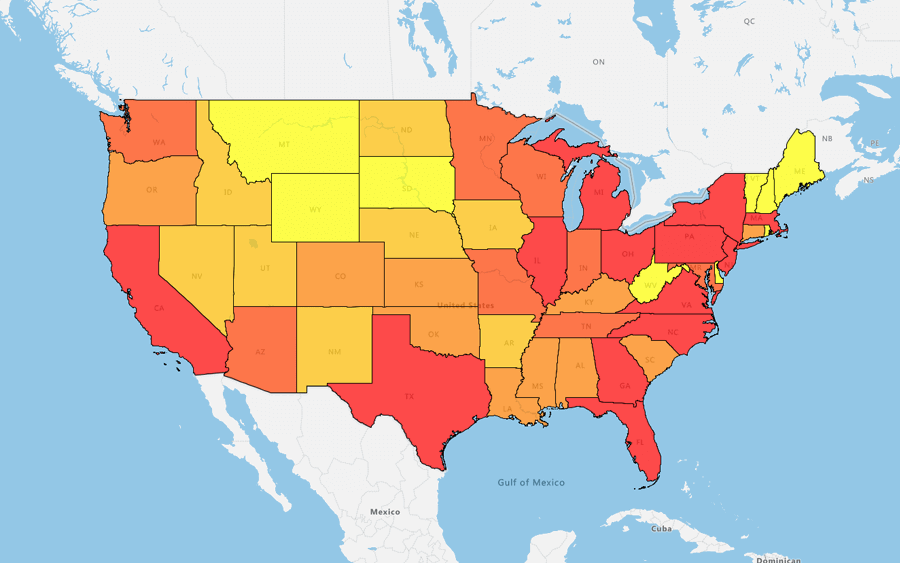
A choropleth map uses geographic boundaries to plot quantifiable attributes. These geographic areas, such as ZIPs, counties, states, or other regions, are colored or patterned in proportion to a variable shown on the map.
For example, a choropleth map of the United States could color states based on average household income, with darker shades representing higher income levels. This immediate visualization makes comparisons and spotting trends effortless.
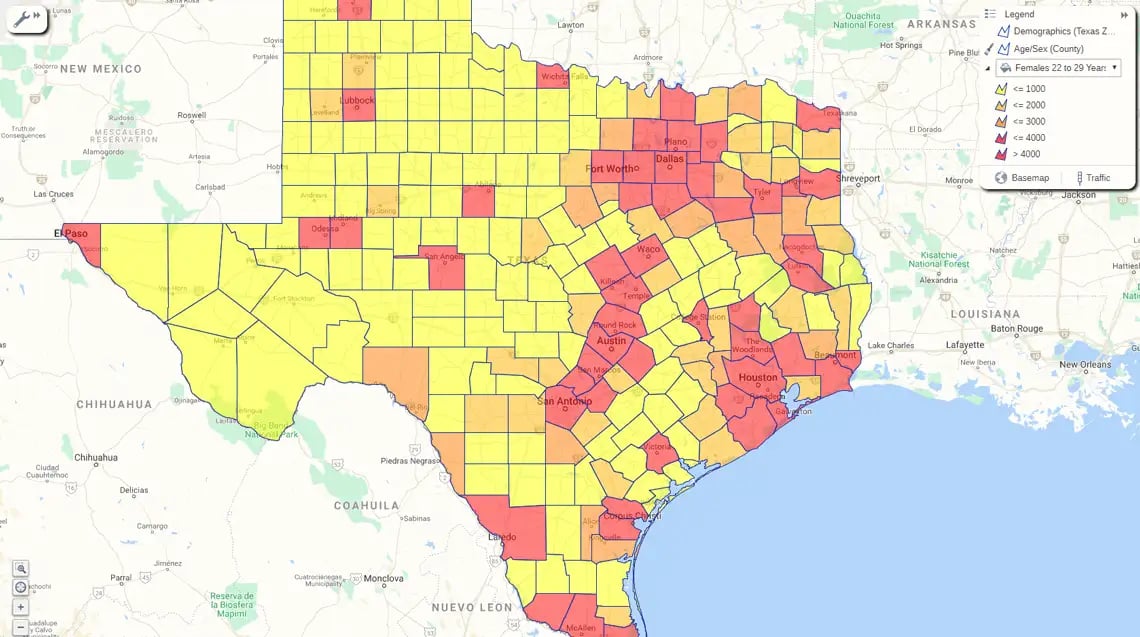
You create choropleth maps using geographic information systems (GIS). Data is assigned to a geographic layer, such as state or county boundaries. The mapping program then assigns visual values corresponding to the data values, such as color shades or heatmap intensities. It marries spatial and statistical data to reveal patterns embedded within geography.
Choropleth maps visualize data that has been aggregated and is tied to predefined regions on the map. Some common examples of choropleth map applications include population density, income levels, sales figures, customer concentration, and more. In short, they empower analysts and decision-makers to comprehend patterns in their business metrics quickly.
Before we get to the advantages and limitations, let’s first answer one crucial question: what is the purpose of a choropleth map in the first place? Simply put, choropleth maps aim to visually communicate data that has a geographic component by mapping variable rates or values across an area using color gradients or shades.
Some common applications include:
- Sales performance across territories
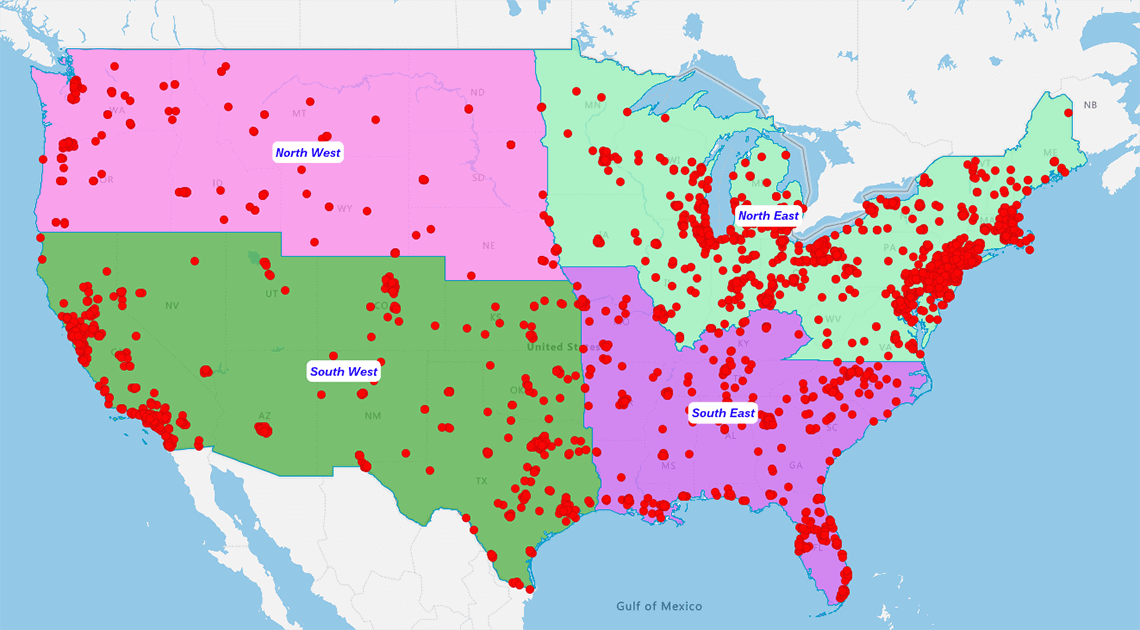
- Market segmentation and customer density
- Identifying growth or risk regions
- Optimizing resource allocation
- Evaluating campaign impact
Choropleth maps' diversity makes them versatile storytelling tools for various strategic business objectives. Let's discuss some key advantages and disadvantages to understand their utility better.
For ops, marketing and sales teams, choropleth maps unlock several compelling benefits compared to tables of numbers alone. Some of the most persuasive choropleth map advantages in sales and marketing include:
1. Easy Comparison
Choropleth maps simplify scrutinizing multiple regions simultaneously at a glance. This scan-and-compare ability reveals outliers that numbers cannot. Marketers gain insights far faster through visual patterns than by wading through reams of data.
By coloring entire regions on a map, sales and marketing teams can spend more time analyzing spatial relationships between high and low-performing areas, uncovering insights that spreadsheets cannot easily show.
2. Visually Striking for Pattern Identification
Distinct color gradients, heatmap intensities, and other visual cues jump off the page, literally coloring in trends. Unusual clusters or geographic consistencies become undeniable, sparking new hypotheses.
The eye is naturally drawn to areas of darker shades that stand out on a choropleth map in a way that raw data does not. It makes spotting anomalies or unexpected correlations instinctual, even for those without specialized analytical training.

3. Enhanced Data Interpretation
Mapping statistics to their geographic context gives numbers real-world relevance. Spatial data reveals relationships between location-based factors that are often missed in isolation. By overlaying company performance metrics with third-party data, like demographics, mapping uncovers patterns and insights that static tables can't.
4. Effective Communication Tool
Choropleth maps convert mountains of raw facts into a digestible visual story. They engage audiences efficiently, helping non-analysts grasp takeaways at a glance. Interactive features amplify this utility for public presentations, reporting, or team discussions.
Like no other format, choropleth maps can synthesize complex insights and nuanced relationships in a universally understandable manner, making them precious aids for everything from sales pitches to executive briefings.

5. Easy for Anyone to Use
Modern choropleth mapping tools democratize GIS. No training is required to explore insights - perfect for busy marketing and sales teams. Even novice users can leverage location-based intelligence from these simple, scannable graphics, especially in modern GIS software.
The advantages of choropleth maps are plentiful, but it's also essential to understand some of their inherent limitations, as no single report type will perfectly convey all insights. Here are a few limitations of choropleth maps:
1. Can oversimplify sales data
Aggregating to regions can mask localized hotspots or outliers.
2. Relies on predefined boundaries
The predefined geographic partitions that define choropleths, like census tracts or county borders, may not align with natural market seams.
3. Can distort values
Choropleth maps have the potential to spatially distort data values as they are aggregated to unevenly sized predefined regions.
Deploy choropleth maps when you need to:
- Compare territories with sales territory mapping software
- Achieve territory optimization for balanced workloads
- Communicate insights to marketing and sales teams
- Leverage visualizing spatial patterns using cluster maps
- Integrate marketing mapping software into campaign planning
Transform your quantitative data into strategic action. Start your free eSpatial trial today and harness the power of location intelligence!