Quick answer
Looking for the right type of map to turn your business data into actionable insights? We'll break down 7 key map types used in data visualization, and when to use each one.
- Pin Maps: Plot and view individual data points for quick visual analysis
- Regional Heat Maps: Aggregate and color-code performance by geographic region
- Heat Maps: Spot data density trends, like customer or sales concentration
- Territory Maps: Design, balance, and manage sales or service regions
- Route Maps: Plan and optimize travel routes for sales or logistics teams
- Bubble Maps: Compare data values visually using proportional circles
- Nearest Neighbor Maps: Find closest leads, reps, or locations with precision
Understanding Map Visualizations
in Business Contexts
Visual maps help transform raw data into clear, location-based intelligence. By understanding the different types of maps, businesses can choose the right visualization method to match their goals. The right map helps solve logistical inefficiencies, uncover market gaps, and align strategy with geography.
Key Map Types for Analyzing
Location-based Data
Here are 7 types of maps used for data visualization that our customers create using our mapping software tools. We also demonstrate how and why they use them. Use these map examples to decide which one is right for your business.
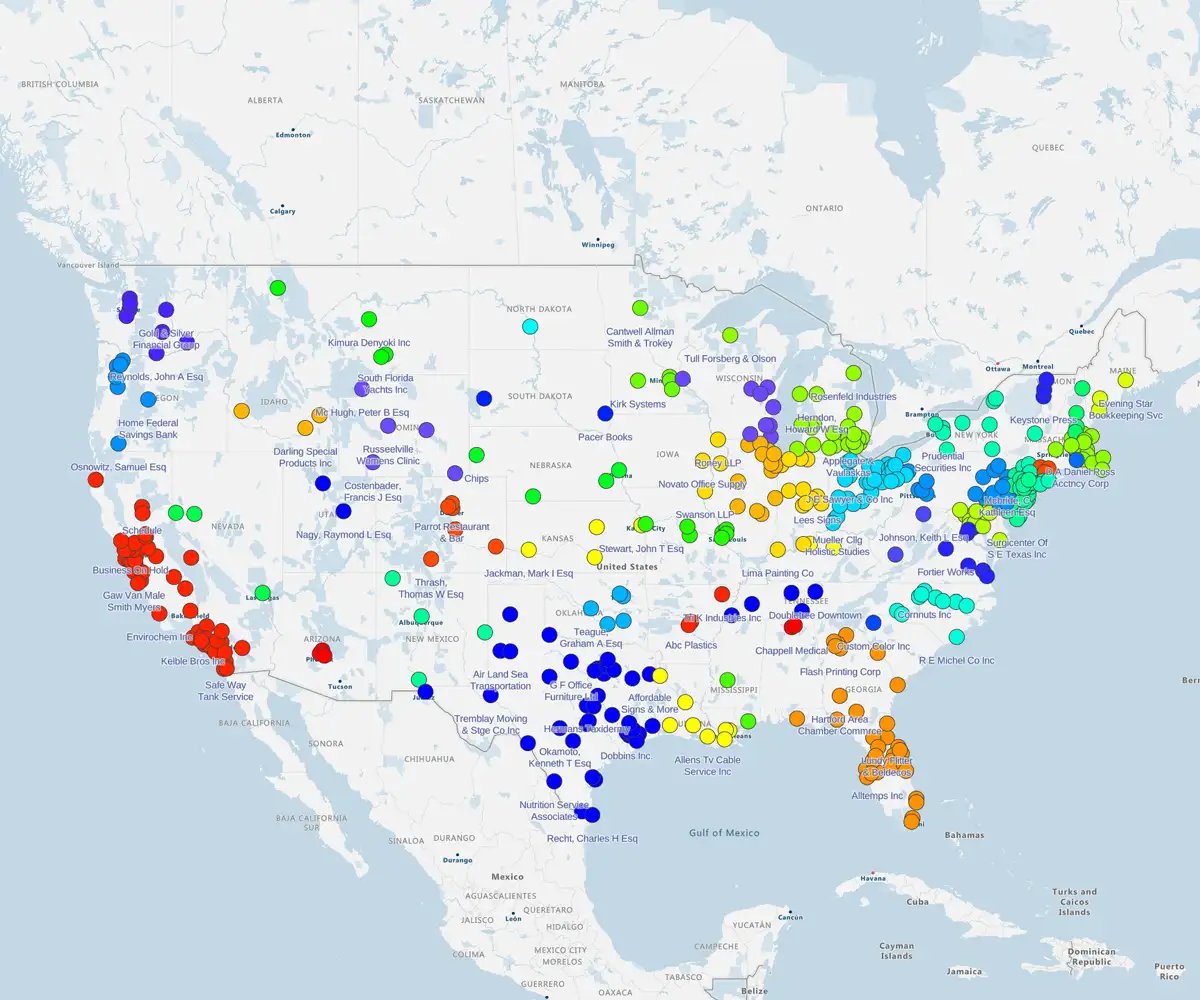
1. Pin maps
View a larger version of a Pin Map created with our mapping software
The simplest map type. Just upload your business data, which plots in seconds (depending on the file size). Once your data plots, you can customize your map with various options, including different base maps (satellite, terrain, etc.), pin color, and pin style – including the ability to plot your pins (e.g., company logos) on the map.
Businesses use pin maps to:
- Spot customer clusters and identify high-potential regions
- Visualize sales or service activity across reps and territories
- Plan site visits, events, or deliveries more efficiently
Used for data visualization, geographic patterns, and trends. Create a simple pin map.
2. Regional heat map
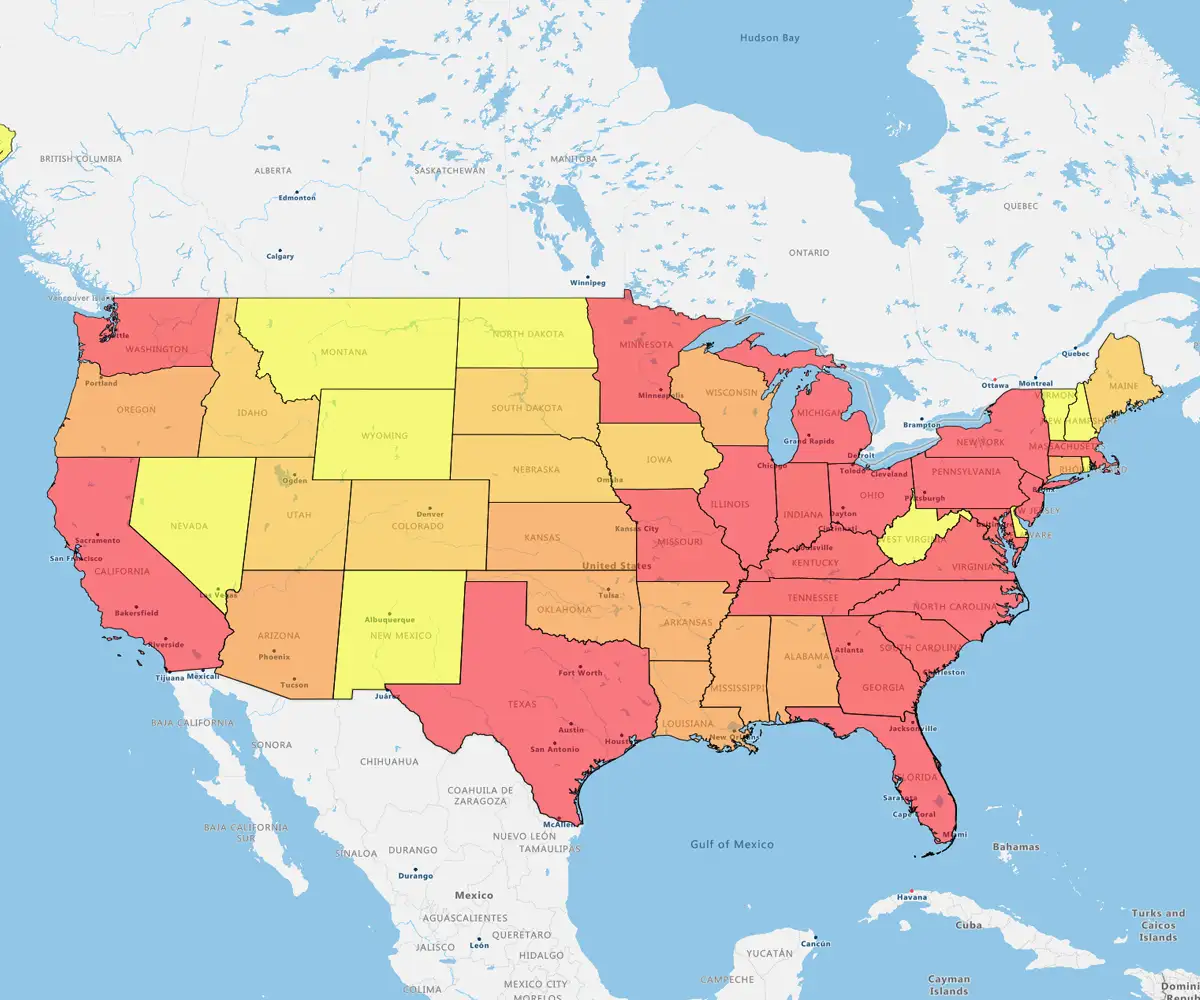
View a larger version of a Regional Heatmap
created with eSpatial mapping software
Our users' most popular choice is the regional heat map. You can color geographic regions (such as US states, counties, and ZIPs) to reveal different levels of intensity of your data. For example, you can see the location of the highest (red) and lowest (yellow) value states on a state-by-state basis.
You can layer other pin datasets on your map for more flexible analysis. It is the best way to summarize your data for others to understand. It can also be included in a report or presentation.
Used for making complex data easier to understand and aggregating data by region. Create a regional heat map.
3. Heat maps
View a larger version of an Accounts Heat Map
created with eSpatial mapping software
Heatmapping is an excellent way to identify market or market coverage gaps. Your heat map's data values are colored, offering you a unique market overview. See where you excel and where you need to focus.
One example of a heat map is a customer density map. These maps are especially valuable for businesses with physical presence, field teams, or region-based strategies. High levels of customers are colored orange, whereas low levels are light blue shades.
Used for spotting sales patterns by density and by value. Create a heat map.
4. Territory maps
View a larger version of a Territory Map
created with eSpatial mapping software
Sales organizations use location-based territory management software to view service and sales areas, analyze sales performance and create maps for sales teams. It's perfect for regional insights and management. You can also use them to balance territories by customer count, revenue potential, or travel time.
You can form territories by combining geographic boundaries. These could be ZIP codes, or large geographic boundaries, such as states and countries. If you have your territory structure laid out in a spreadsheet, you can upload it and create your territories in seconds.
Used for sales territory mapping, organization, and delegation.
5. Route map
View a larger version of a 25 Point Route Map
created with eSpatial mapping software
Route maps are an indispensable business tool that can save hours on journeys. They boost productivity and help reduce fuel costs. Route optimization ensures that your sales reps travel the least number of miles for the maximum revenue.
Used for planning and optimizing routes. Create a route map.
6. Bubble map
View a larger version of a Bubble Map created with eSpatial mapping software
Bubble maps are one of the best ways to communicate proportional location-based data clearly and concisely. Like heat maps, bubble maps can summarize data levels in a particular region. Through data layering, they can combine multiple data points such as revenue, customer count, and rep location.
For example, you can map all customers within an area to give a summarized revenue number expressed by the circle size. Bubble maps are great for reports and presentations. They can also be embedded on a web page.
Used for proportional representation and data visualization. Create a bubble map now.
7. Nearest neighbor
View a larger version of a Nearest Neighbor Map
created with eSpatial mapping software
The nearest neighbor map is a powerful tool for salespeople. It’s also often used by logistics organizations to plan routes. The Nearest Neighbor map does not generate a radius field but finds a set amount of data closest to a center point.
For example, at the end of the quarter, your sales team needs to close quick wins. By uploading salesperson and prospect location data, you can run a nearest neighbor analysis to see who's closest to each lead. This helps assign the right rep to the right opportunity and streamlines route planning.
Real-world Applications
of Map Visualization
In today's data-driven world, geographic visualization gives businesses a competitive edge. Traditional reports often miss spatial patterns that drive smarter choices. Map tools turn complex data into clear, actionable insights fast.
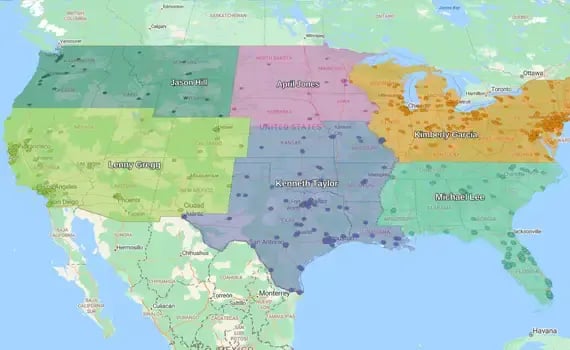
1. Sales and Territory Management
Sales teams use maps to design territories and optimize routes. Visualizing performance geographically reveals top regions and helps balance workloads. This leads to smarter, data-driven decisions on resource allocation and territory changes.

2. Distribution and Logistics Optimization
Businesses like wholesalers and distributors use heat maps to analyze customer locations in relation to distribution centers. This reveals ideal spots for warehouses and service hubs. It also helps optimize delivery routes and cut transportation costs.
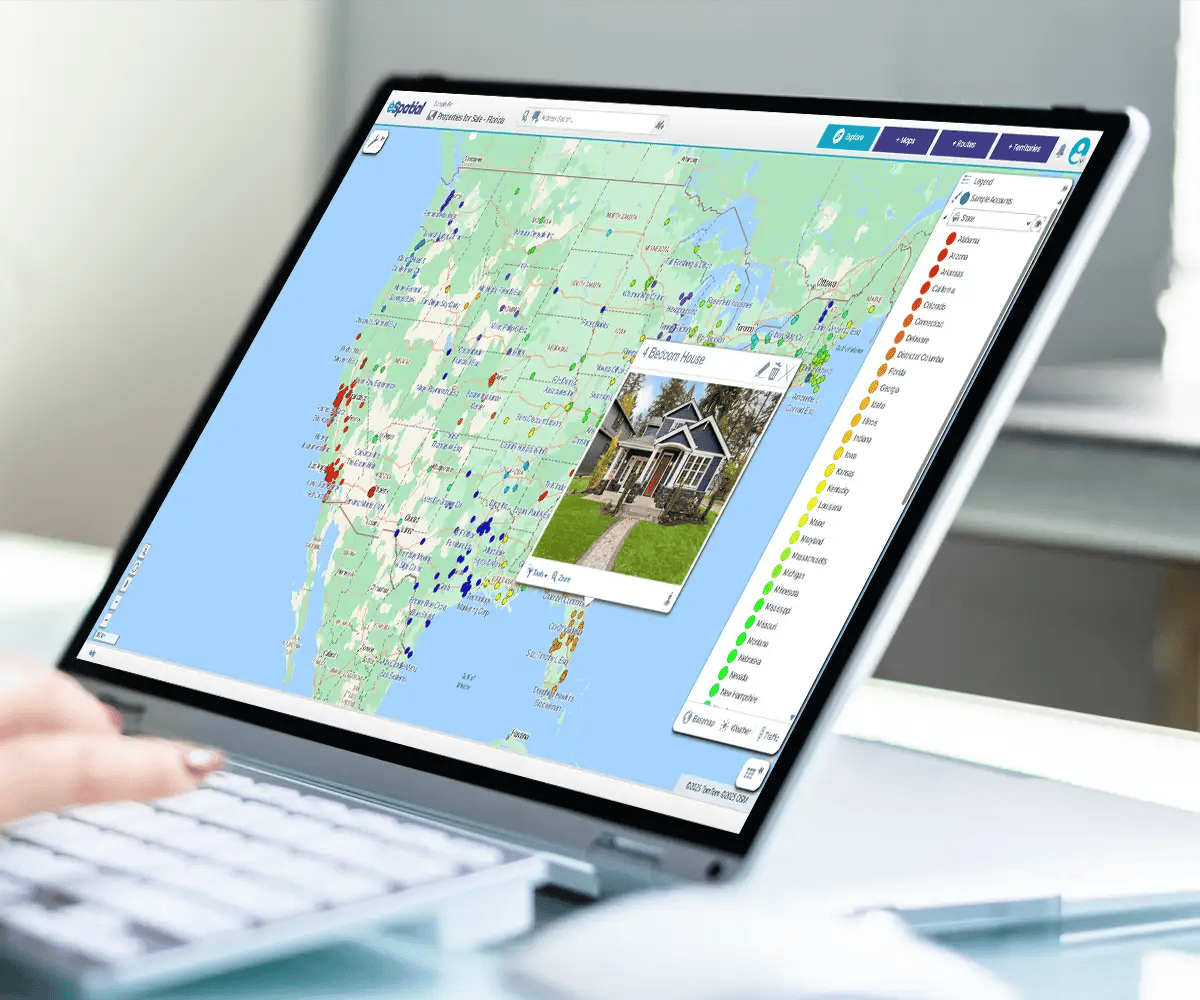
3. Real Estate Market Analysis
eSpatial's mapping platform helps visualize complex data for real estate organizations. It is used to analyze property values, demographic trends, and market opportunities across different geographic areas. This enables better investment decisions and market entry strategies.
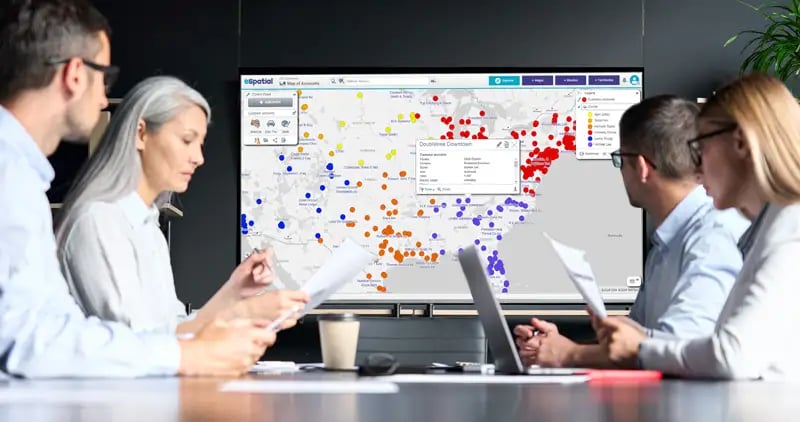
4. Marketing Campaign Planning
Demographic heat maps help pinpoint ideal locations for advertising campaigns, from billboards to digital ads. They show where target audiences are concentrated. This boosts campaign ROI by ensuring smarter, more focused outreach.

5. Healthcare and Service Planning
Healthcare providers use mapping to analyze patient density and spot underserved areas. This guides better decisions on where to place facilities. The result is more equitable service coverage and smarter resource allocation.

6. Retail Site Selection
Retailers use mapping software to analyze foot traffic and demographics to find the best store locations. You can perform competitor analysis with maps as well as generate marketing and location insights. Built-in data layers help you profile customers and spot market opportunities.
7. Supply Chain Risk Management
Companies visualize their supply chain networks geographically to identify potential vulnerabilities, assess regional risks, and develop contingency plans based on the geographic distribution of suppliers and customers.
Conclusion
So there you have it. 7 types of maps to plot, analyze, and present your business data. If you have any questions about the different types of maps and their uses, jump on a live chat to find out more about our business mapping solutions and eSpatial plans and pricing.


