Heat maps

The perfect map to analyze and present critical data

What are heat maps

Heat maps have become everyday tools for sales, marketing, revenue operations, and service teams. If you watch the weather report, you'll see heat maps and how powerful they are at conveying complex information simply.

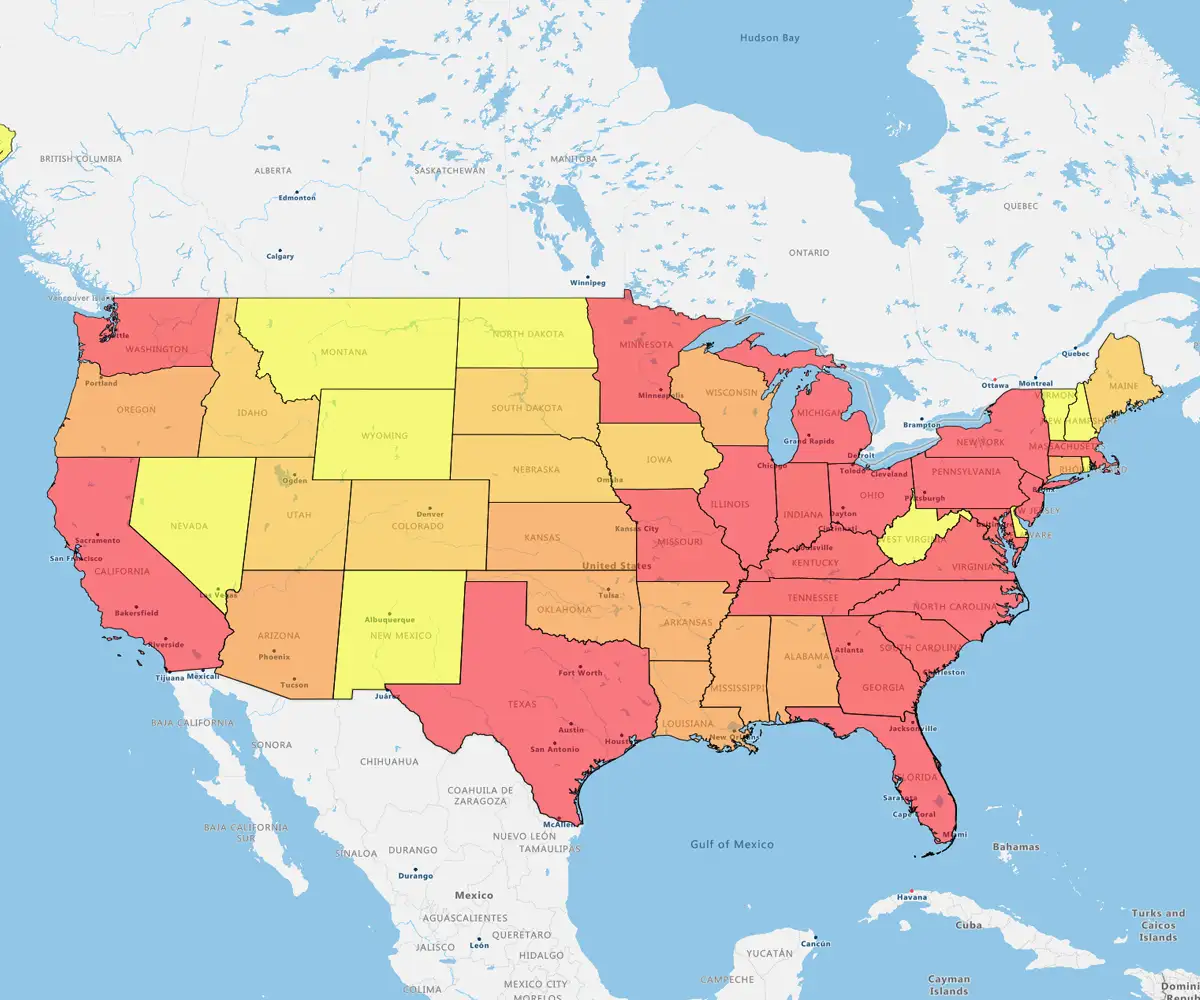
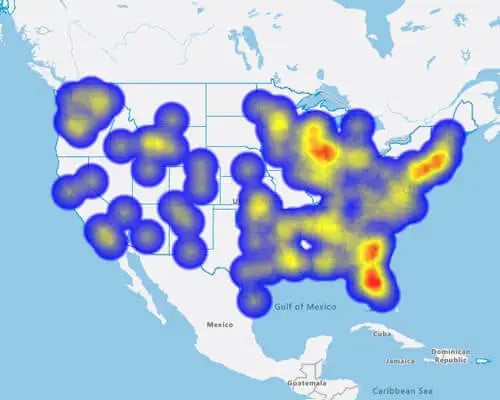
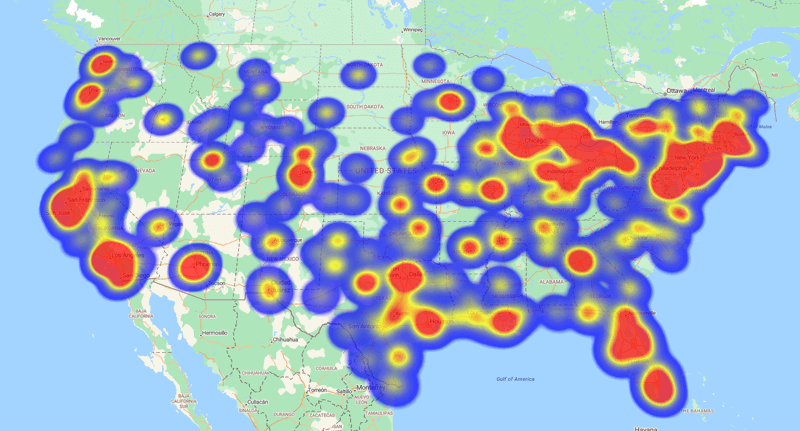
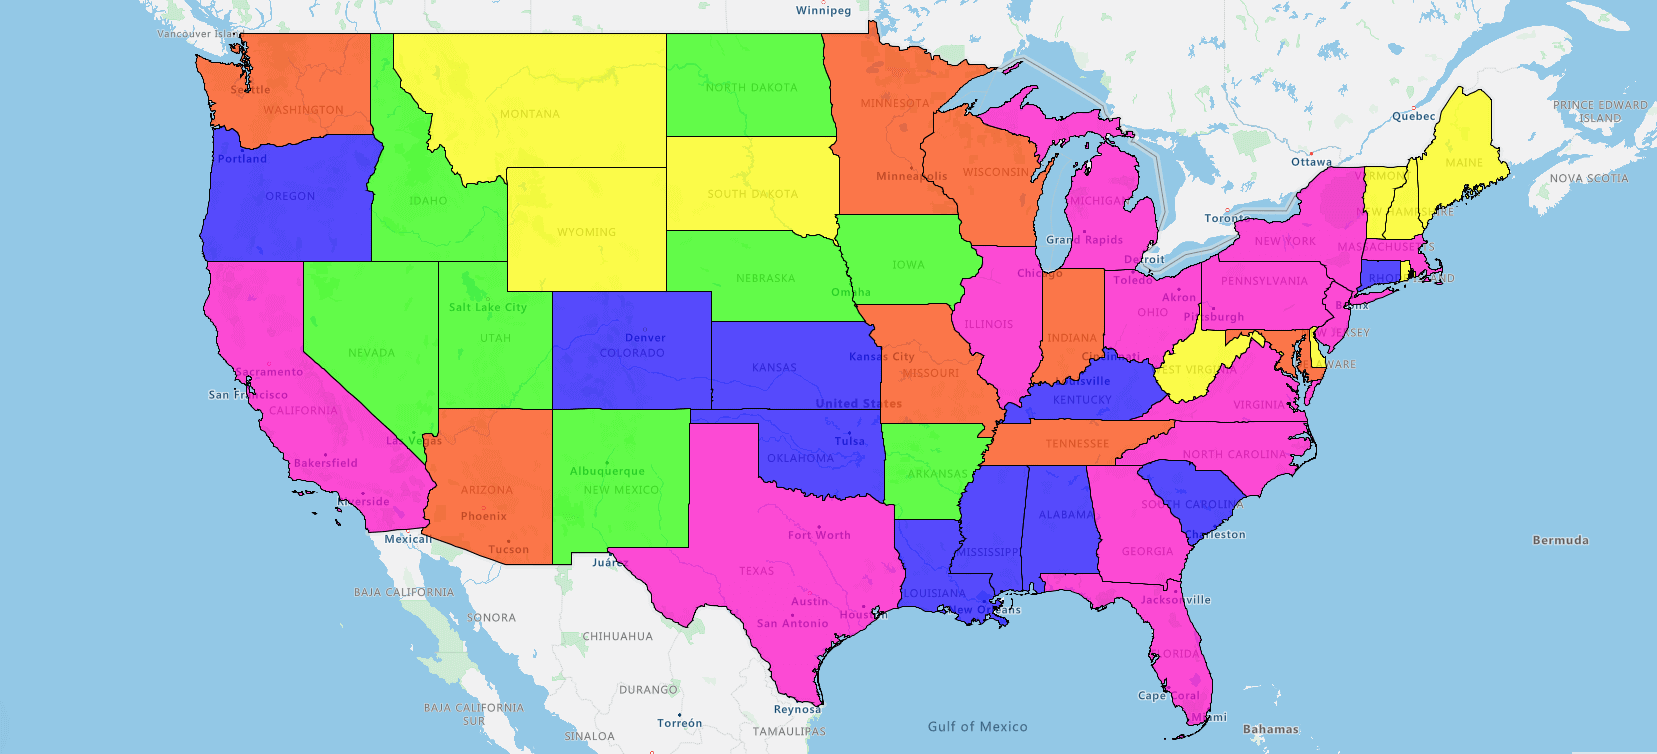
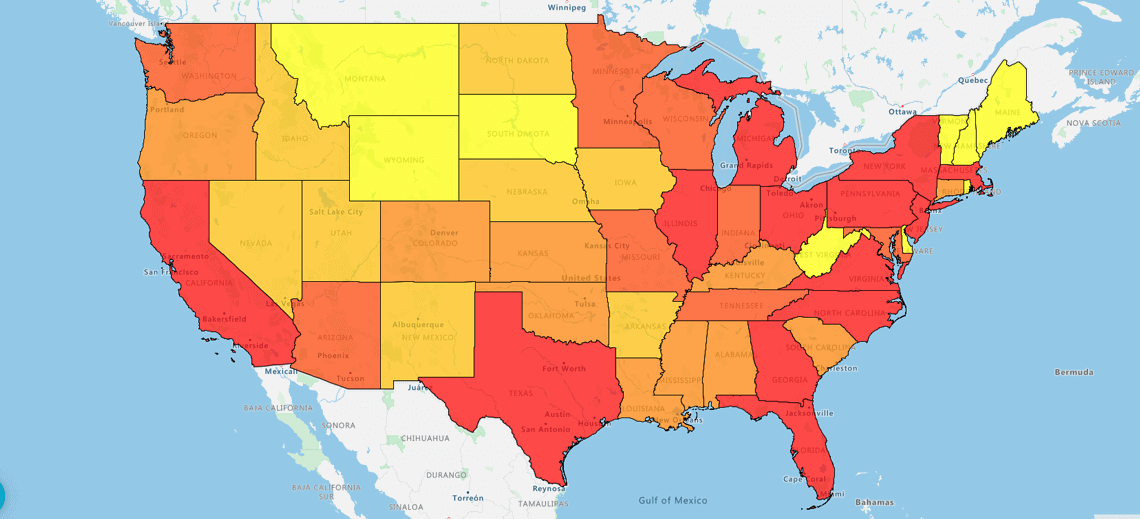
Heat maps (choropleth maps) use colors and shades to display data densities in a region or regions. For example, on your map, you might see high concentrations of customer locations in red ( a hotspot) and lower levels in a cooler color, like blue. It makes analyzing and showing complex datasets easier.

If you have seen population densities on a map, you were looking at a heatmap. The highly populated areas are in darker colors, and the low populations are in light colors (you can choose your preferred colors). The heat map showing your data as colors in a region gives the viewer an instant snapshot and conveys a data story. It is why they are among the most popular map types used in businesses.

Check out our Conquering mapping software guide


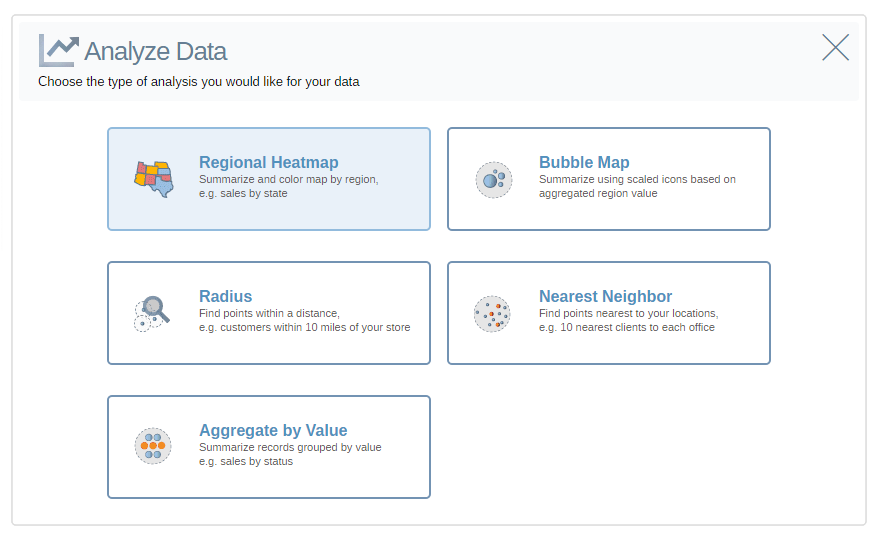
You can create two types of heat maps with eSpatial


Why and when to use heat maps

Why choose eSpatial for heat maps

  • Get an instant overview of market performance
  • Quickly identify high or low-performing regions
  • Uncover new pockets of growth
  • Unlock inefficiencies in sales or service coverage
  • To view your property portfolios by ZIP
  • Identify customer concentrations near distribution centers
  • Hone in on asset concentrations
  • Spot new areas to grow sales
  • Analyze competitor location densities (where they are strong or weak)
  • Map your rep locations with prospect densities
  • Display your sales pipeline hotspots and refocus your sales reps for a campaign
  • Simplest to use – Create your heat map in 2 steps
  • Available where you work – Get eSpatial in Salesforce, Apple, and Google Play stores
  • Free 7-day trial so you can try before you buy
  • eSpatial support is the best because you can talk to a real mapping expert who will guide you in person at no extra cost
  • Easy sharing, collaboration, and publishing options to make your heat map available to others

How to guides

How To create geographic heat maps

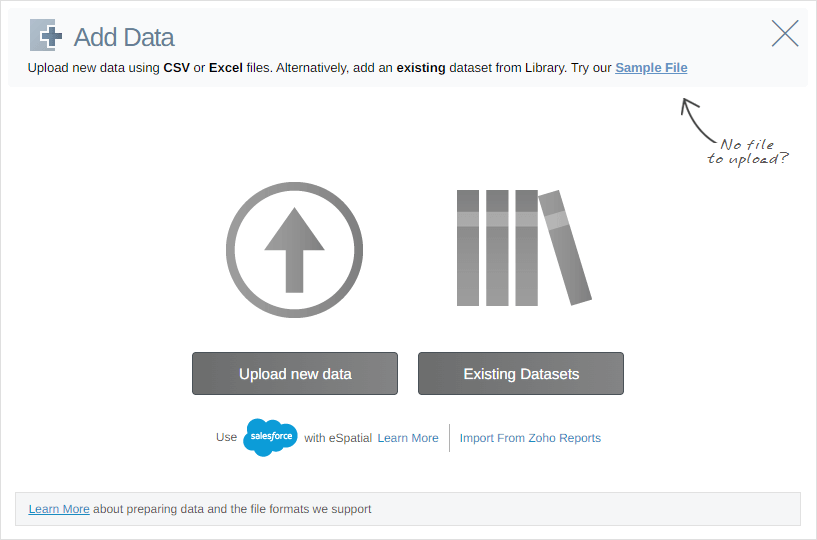
Using eSpatial mapping software you can create heat maps in minutes, with just a few clicks. All you need is to have location data (zip code, address, county, country, etc) contained in an Excel spreadsheet. Sign up for a free trial, upload your data, and create different types of heat map – in minutes. These maps are created as web pages and can be accessed by whoever you wish, by simply sharing the URL of the webpage.

Create heat maps from different sources

Using eSpatial mapping software you can create heat maps in minutes, with just a few clicks. All you need is to have location data (zip code, address, county, country, etc) contained in an Excel spreadsheet. Sign up for a free trial, upload your data, and create different types of heat map – in minutes. These maps are created as web pages and can be accessed by whoever you wish, by simply sharing the URL of the webpage.


Do you have questions about heat maps?

Think of your heat map as a base map or canvas to overlay your datasets.

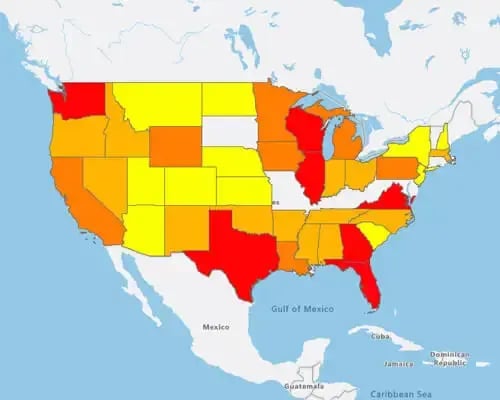
Imagine you run a chain of care homes across the US and want to display the percentage levels of retirees per state.

Simple. Just import your data and use a regional heatmap to show you opportunities to expand.

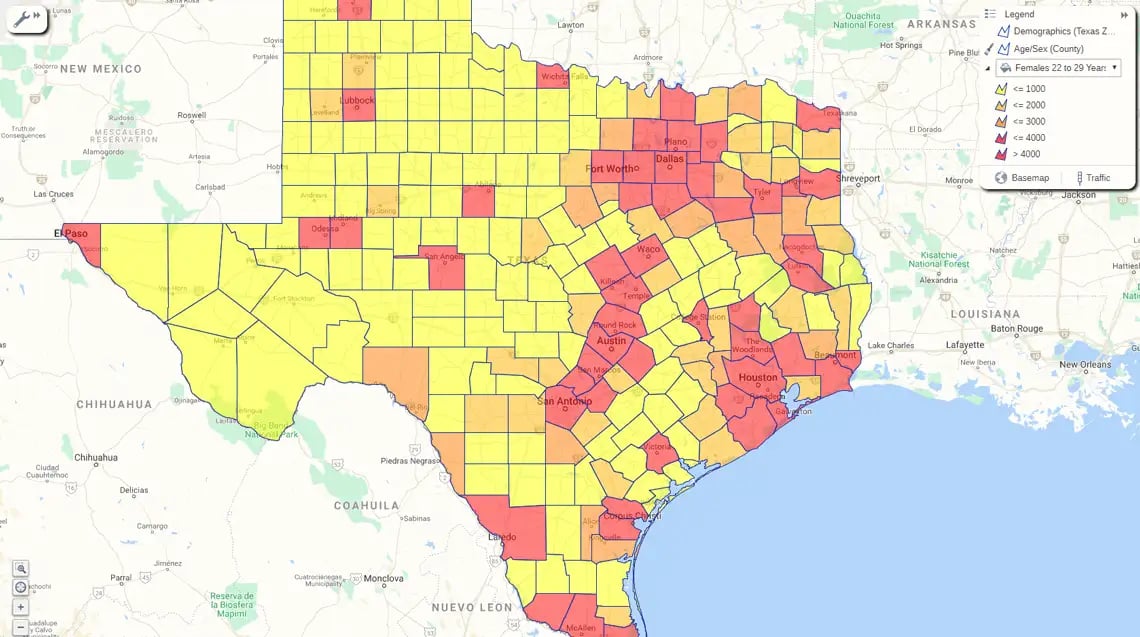
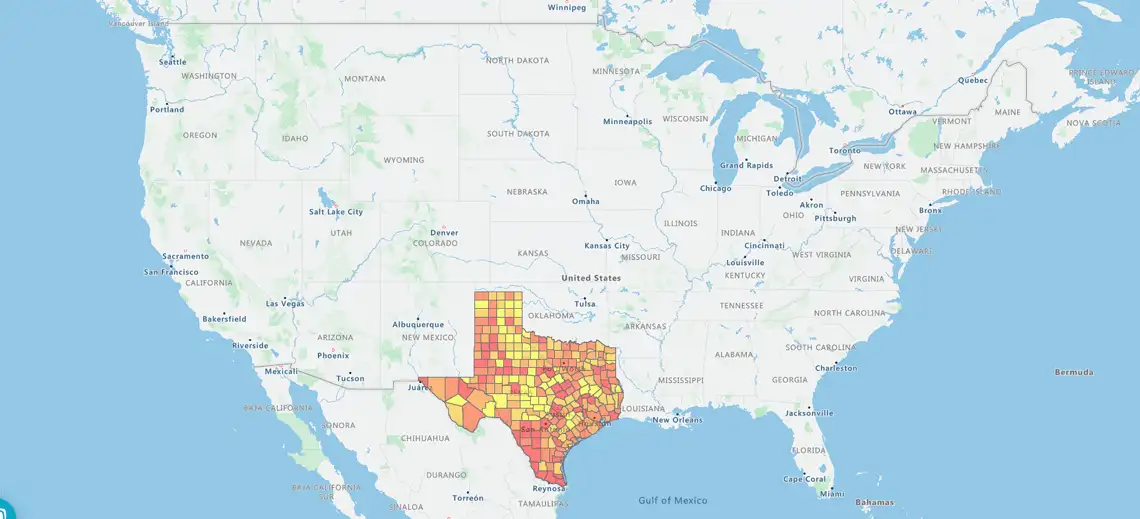
You may prefer to create a color-coded map manually, but the easy method is to link your data to boundaries. For example, you choose ZIPs as your selected boundary definition.

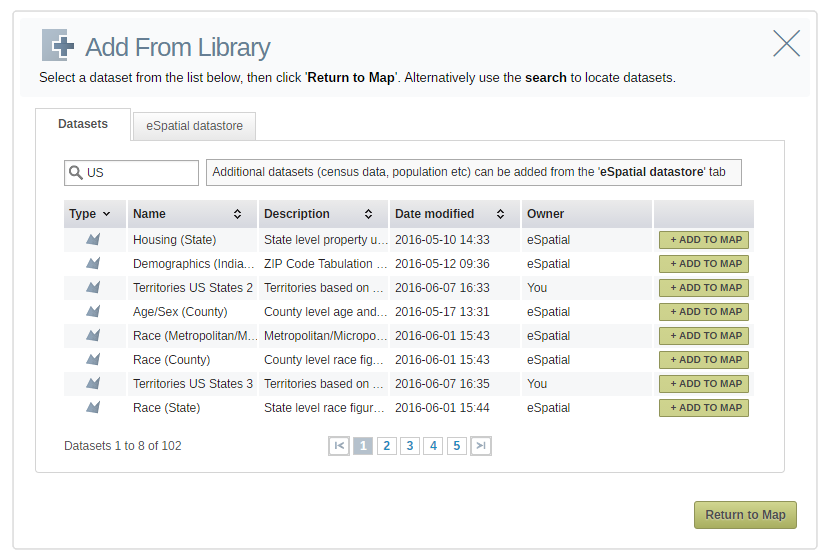
When importing your dataset, use the eSpatial wizard, which detects your data and your boundary definition and does the magic for you.

What is the difference between a heat map and a color code map?

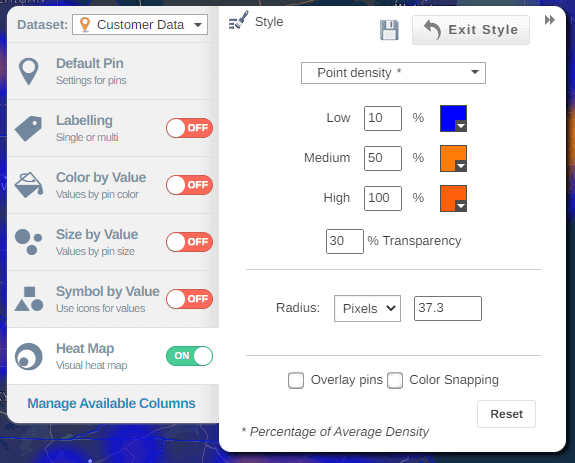
Use heatmaps when you want to display the density of similar data. For example, you want to know see customer locations as clusters.

Use color-coded maps when you want to show your customer data as colored pins so that a red pin may represent your highest-value customers. It won't map the customer densities.

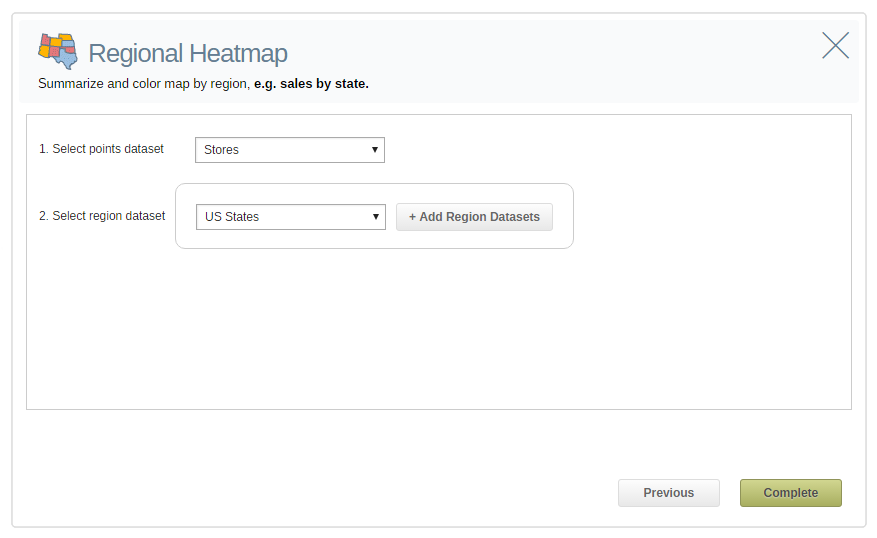
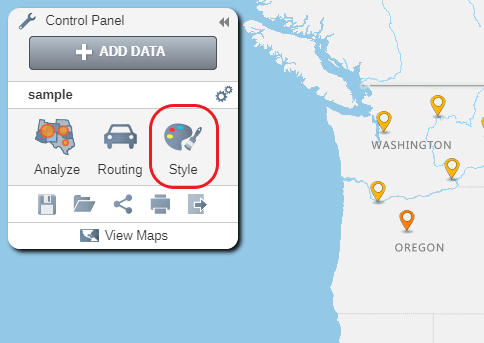
The type of heat map you use depends on what you are hoping to show. A visual heat map is best if you want to look at your market and account density. To look at your team's performance or by region, then a regional heat map is best.

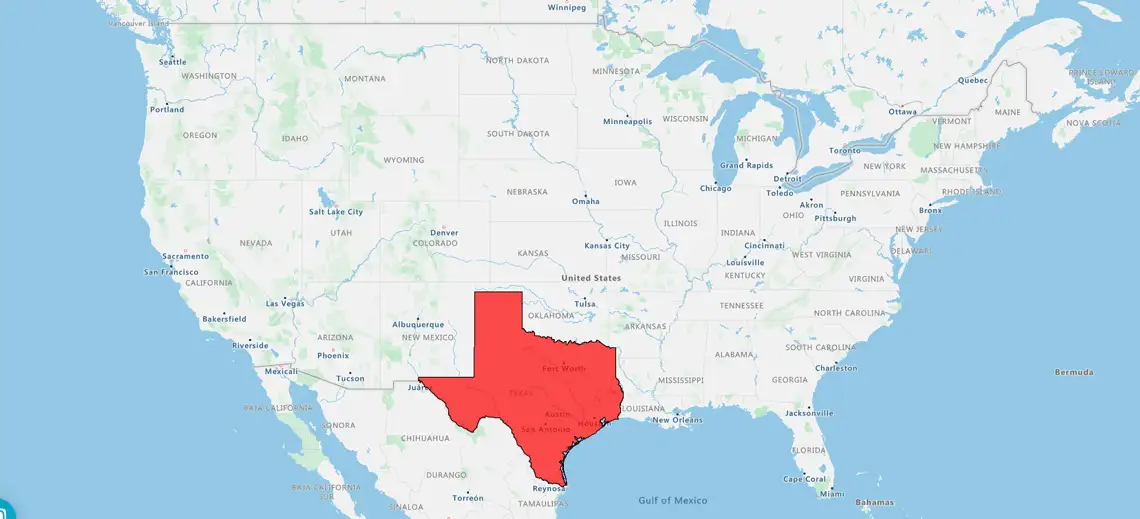
Creating a regional heatmap is a quick and simple way to get a count of accounts that fall within your rep's territory. Once designed, you get a visual representation and can export your data to realign your territories.


Sign up for a free trial

Create your own heat map today


eSpatial requires JavaScript to run. Please enable JavaScript to sign up for a free trial

Once you sign up you will be automatically logged in to start your free trial