Generate and analyze your heat map online

Liam Costello by Liam Costello  |  6 minute read
Try it for free

Creating a heat map online using a tool like eSpatial is, in itself, not a very complicated process. But that doesn't mean it's something you can simply do without much thought or consideration, and then go about the rest of your day. Quite the contrary.

Like most things in the world of sales, the making of a heat map (or any other similar tool) is ultimately data-driven. The final product will only be as good and as useful as the information that goes into it.

So instead of diving right into eSpatial and trying to do everything without any prep, go over the fundamentals first. Soon enough, you'll be able to maximize the value of heat maps for field sales agents, managers, other team members and – in the long run – clients themselves.

What is an online heat map? The basics

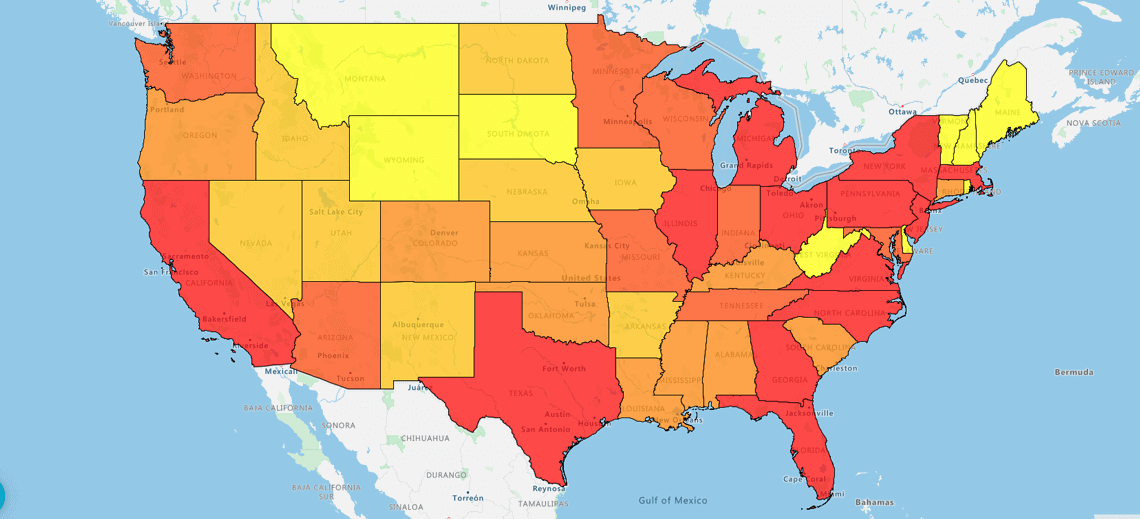
In this case, we're discussing geographical heatmaps, which should not be confused with website heatmaps that help you see user activity on web pages. There's no single purpose for a geographical heat map, so it's not the easiest term to define in a simple sentence. But nearly all of them depict a number of different regions within a larger geographical area (e.g., states in the New England region of the U.S.) and use variances in color to portray rises or declines in density or quantity of a particular variable.

According to Forbes, an up-and-coming software developer named Cormac Kinney created the first heat maps in the mid-1990s. Kinney's early maps weren't geographical in nature, as he used them to depict how securities traded on Wall Street rose or fell in value (blue for the former, red for the latter). But the principles of his map are basically identical to the heat maps used today.

What does a heat map show?

A common heat map might focus on your company's market share of all sales of a given product – let's say that it's vacuum cleaners – in the Sun Belt states of the U.S. You sell well in Florida, Georgia, Alabama and Louisiana, but face a lot of intense competition in Texas, Arizona and New Mexico.

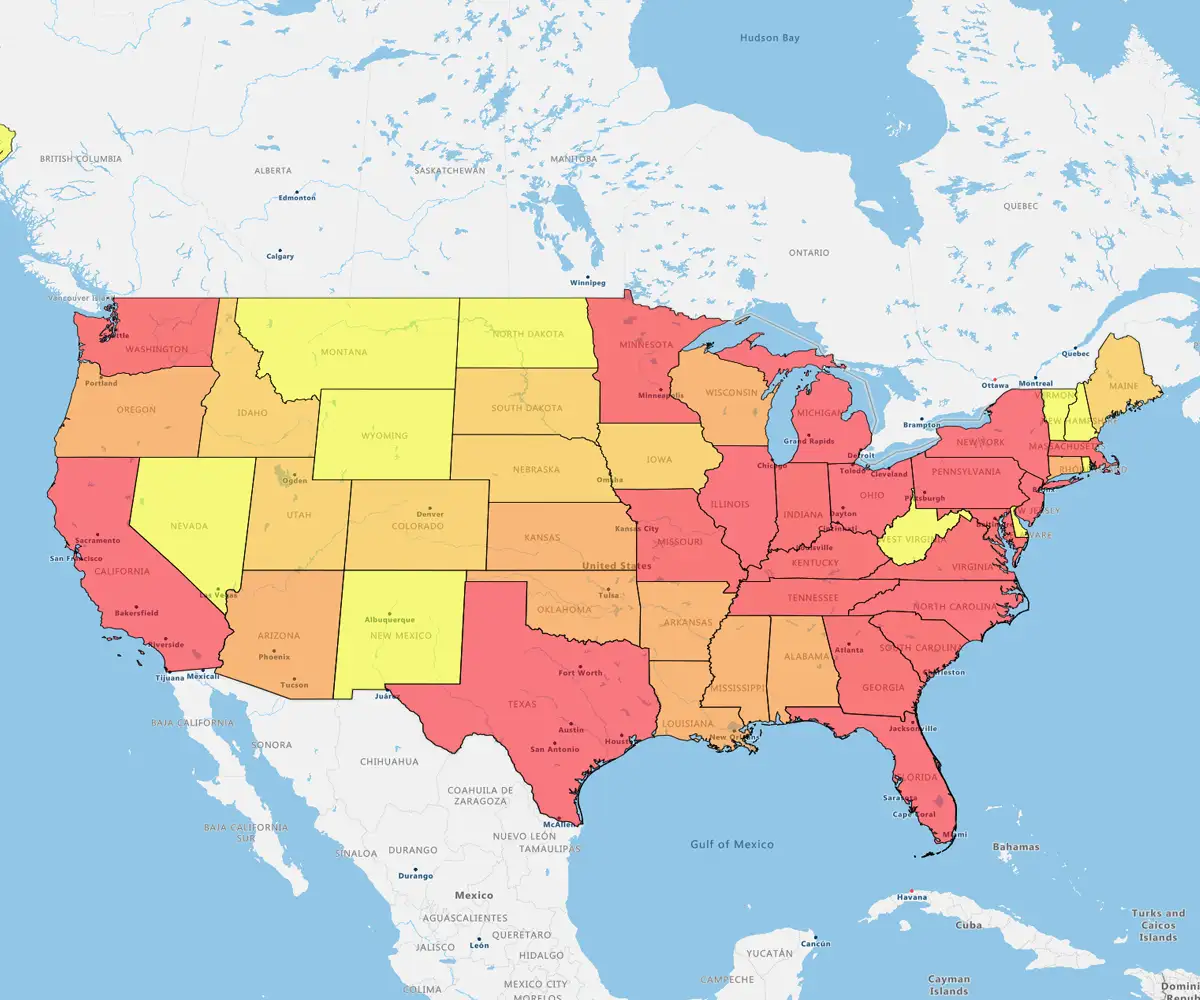
On your map, the states where you have a dominant market share would be red or intense orange. Yellow, meanwhile, indicates states where you have a less impressive piece of the action. (The red-yellow gradient works well for heat maps in general because of the intensity of the color at both ends of the spectrum. You want someone's eye to catch both the best and worst things on a heat map.)

Why is an online heat map tool so important?

The main takeaway when discussing heat maps is the wide range of mapping possibilities that they offer. Basically, any data set that you might come up with in the course of your regular sales operations can work in this context. You could compare your market share in a particular territory to the breadth of your physical presence within it (number of sales reps, etc.). You might ultimately conclude that you need a more equitable disbursement of reps to better leverage your team's resources in that area and avoid falling behind your competitors.

But heatmaps aren't only useful for finding out about problems in your territories: You may also discover favorable patterns that you didn't know about. Perhaps a client demographic that you had written off has actually amped up its buying activity in a big way, but you weren't able to determine that until you made a heat map with eSpatial.

The mapping software's robust range of features and firm reliance on the most cutting-edge analytics help you ensure that your sales team is never in the dark about the state of things, whether things out there are heating up or cooling down.

Which type of heat map should you generate?

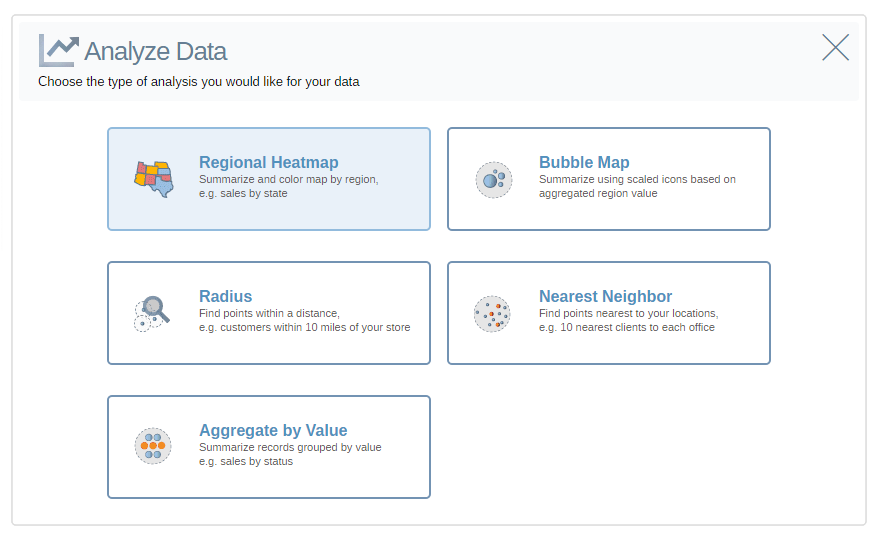
A comprehensive data mapping tool like eSpatial gives you plenty of options for the creation and presentation of sales-related data sets. For heat mapping, you'll want to create one of the following two styles of map (or perhaps both, depending on your purposes):

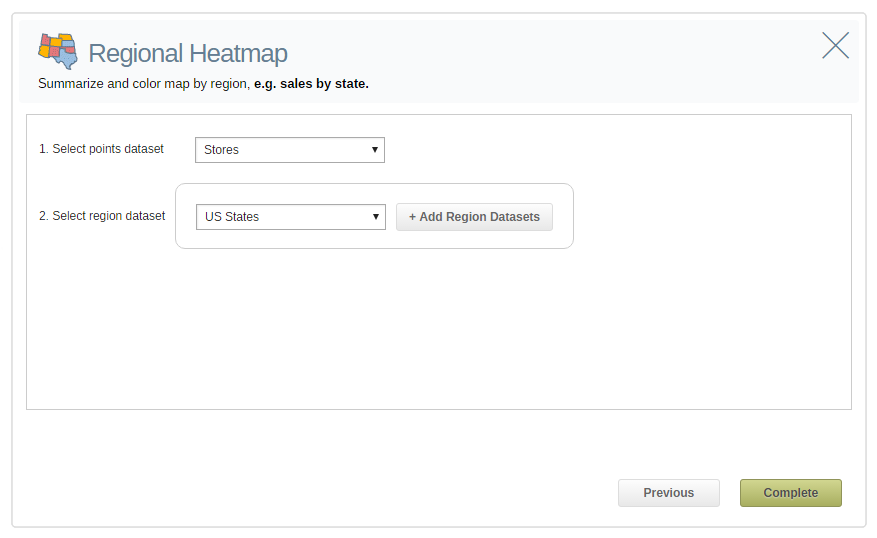
1. Regional heat map

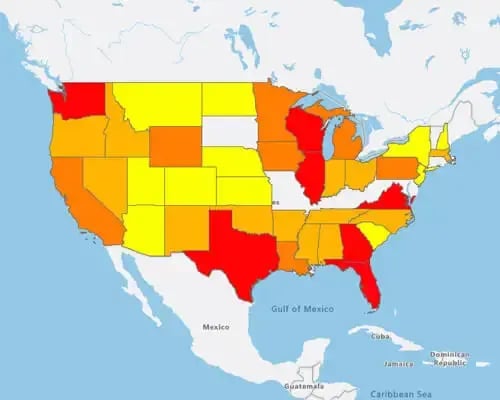
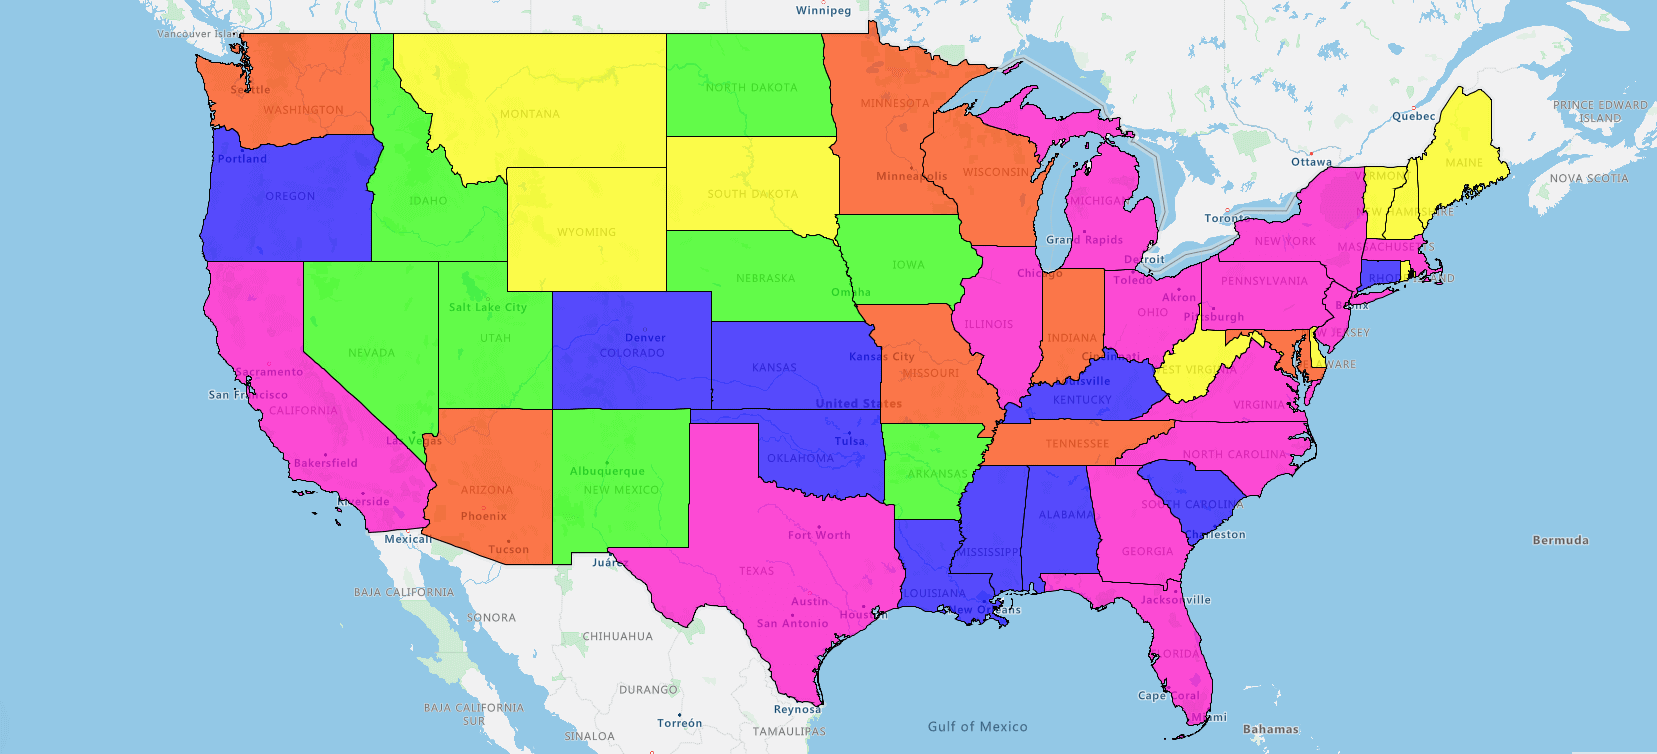
The hypothetical map we referenced earlier, which mapped variances in a company's market share across a cluster of states in the southern U.S., is a good example of a regional heat map. Also sometimes called a "choropleth map," it's color-coded to indicate differences in one particular variable, usually revenue or net profit. It gives sales teams a clear indicator of the highs and lows of their economic performance within various territories and helps them identify smaller trends (sales of specific products within subsets of a territory, for example) that may benefit future marketing and sales campaigns.

Median Income Heatmap

2. Hot spot heat map

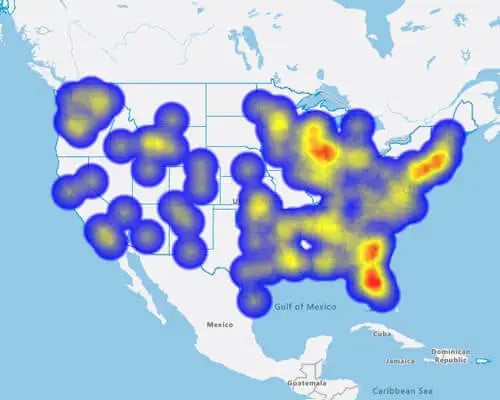
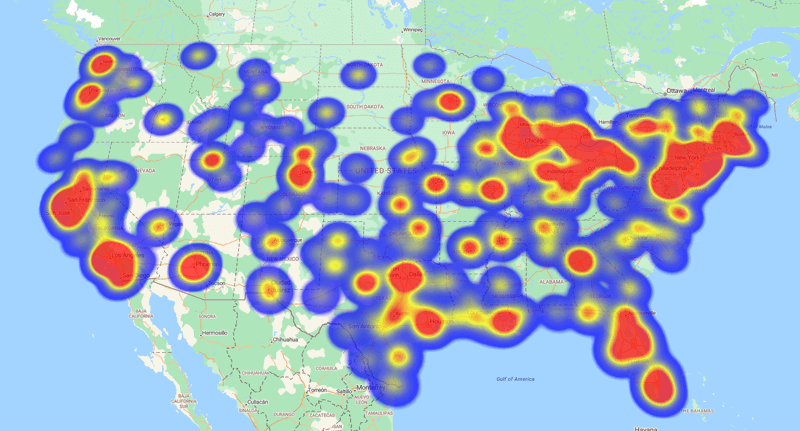
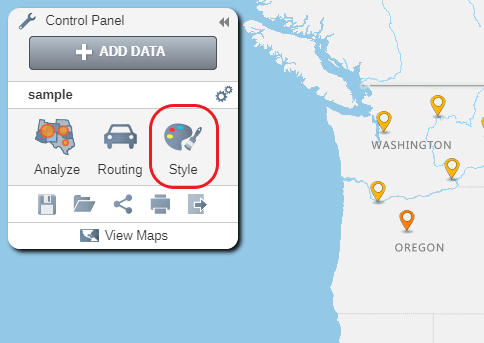
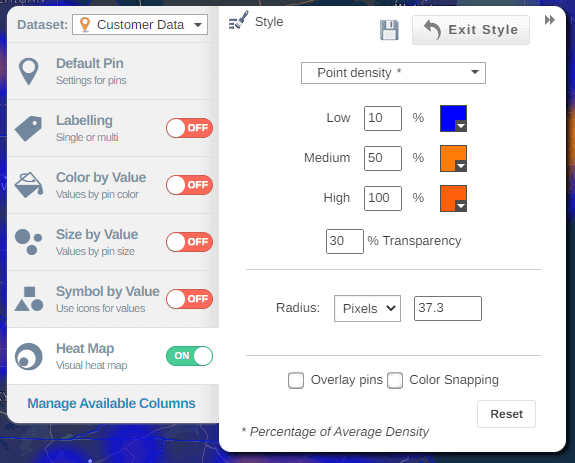
Like their regional "cousins", hot spot heat maps are also used to measure and analyze patterns of high and low activity (sales or conversions, sure, but also factors like customer density). The only real difference is that hot spot maps don't pay as much attention to boundaries: An area with high or low client density on a hot spot map could easily cross a number of different regional or territory boundaries. (Kinney's maps of surging and diminishing securities values could be considered hot spot heat maps.)

Based on such a map's findings, you might conclude that it could be high time to reorganize sales territories and redistribute reps. Doing so better ensures that your team is positioned to pursue all possible opportunities. Also, by using a tool like eSpatial for this purpose, you avoid having to depend on a third-party consultant for your territory-planning needs.

Hot spot heat map

Leverage online heat maps in eSpatial

The map making abilities of eSpatial can be pivotal tools for modern sales teams, especially in an economic environment that's still uncertain and hard to predict.

By using the software to create maps that can be securely accessed in web browsers, reps ensure they always have the most relevant sales data wherever they are – even if out in the field with no devices but their smartphones. Heat maps help your sales team keep their eye on the prize and their focus on the organization's bottom line.


Liam Costello Written by

Liam Costello

Liam is an eSpatial account manager and mapping expert. He specializes in helping businesses solve problems and increase sales through mapping visualization, territory management, route optimization and more. Liam holds a Master's Degree in Geographical Information Systems (GIS) and Remote Sensing.

Read more from Liam Costello