Microsoft's spreadsheet tool, Excel, has been a business staple for more than three decades. According to the software giant, a resounding 1.2 billion people use Microsoft Office. And even if some Office users spend all of their time in Word or PowerPoint, conservative estimates still put the number of Excel users somewhere in the neighborhood of 800 million.
A lot of sales teams rely heavily on Excel. Even if they have an enterprise CRM platform, internal team data and data on customers and prospects is often still found in spreadsheets.
Excel offers a number of features sales reps and their managers know and like. From conditional formatting to pivot tables these features make it easy to manage, manipulate and visualize data.
But Excel falls short in one area: geographical heat maps.
What is a geographical heat map?
Before we look at different heat map generators, it's helpful to first understand what we mean by a "geographical heat map".
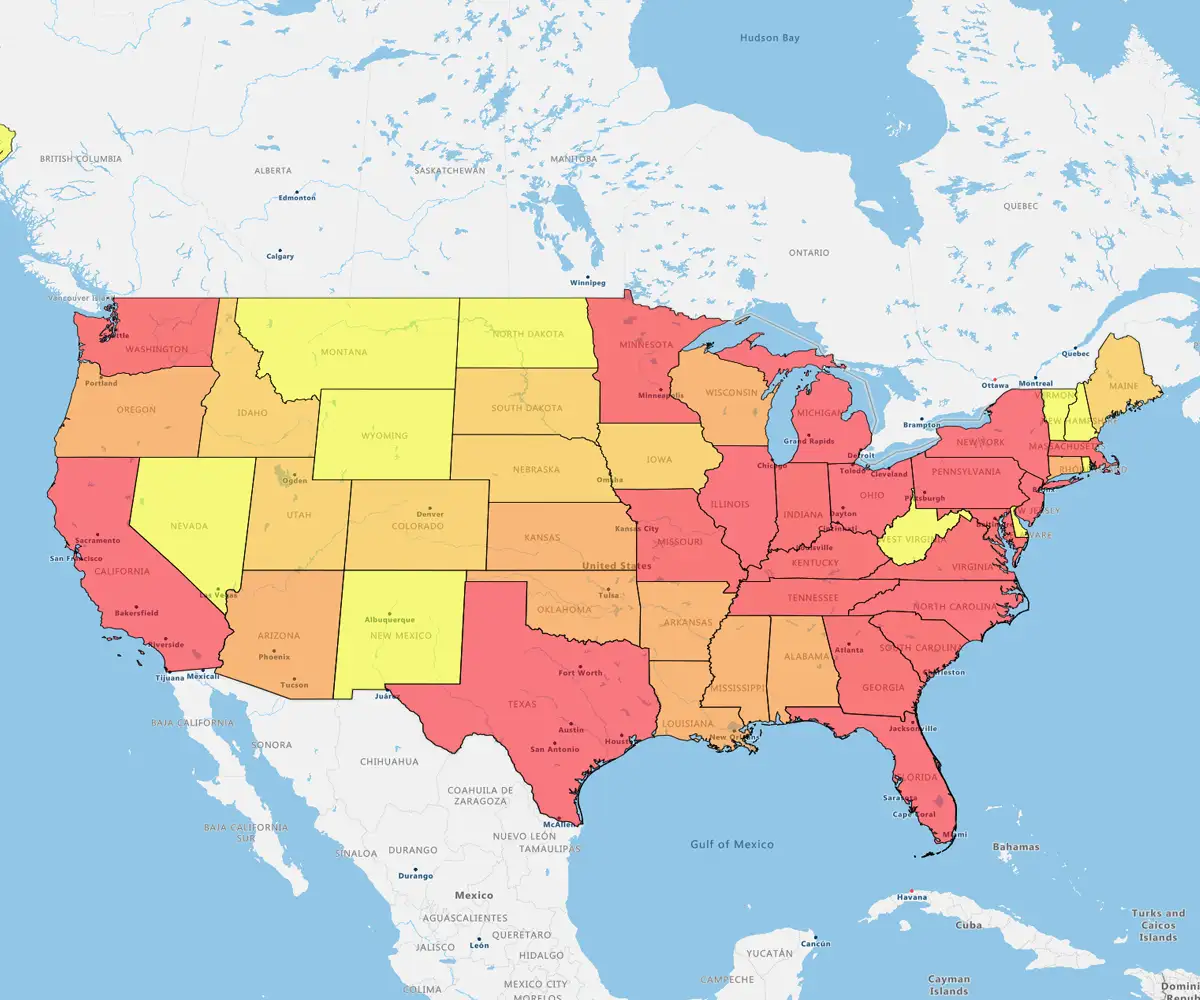
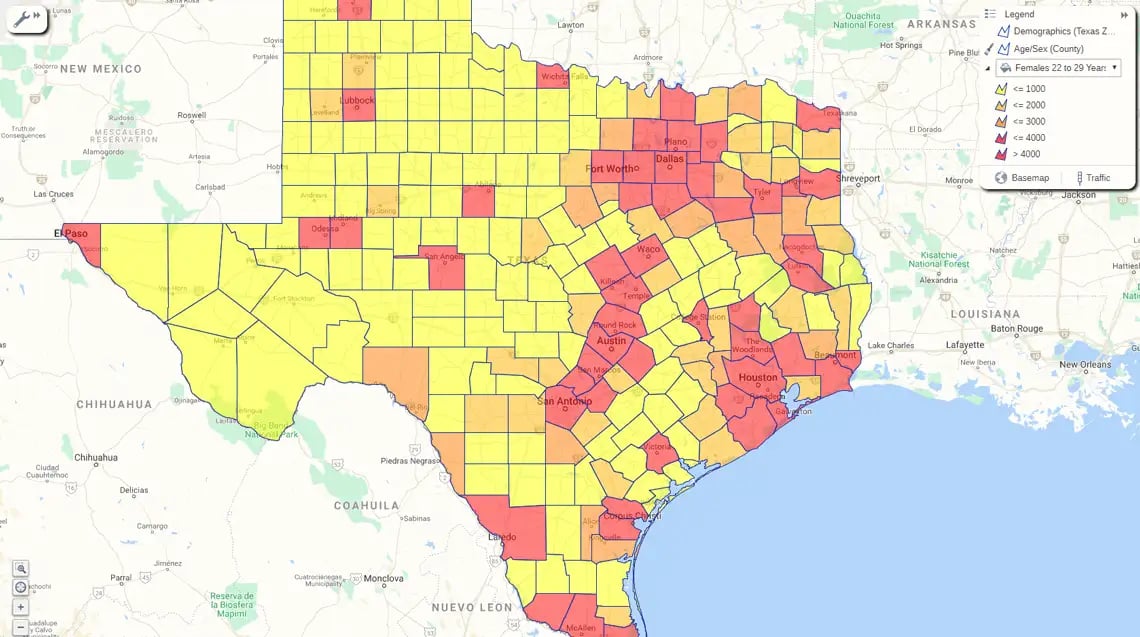
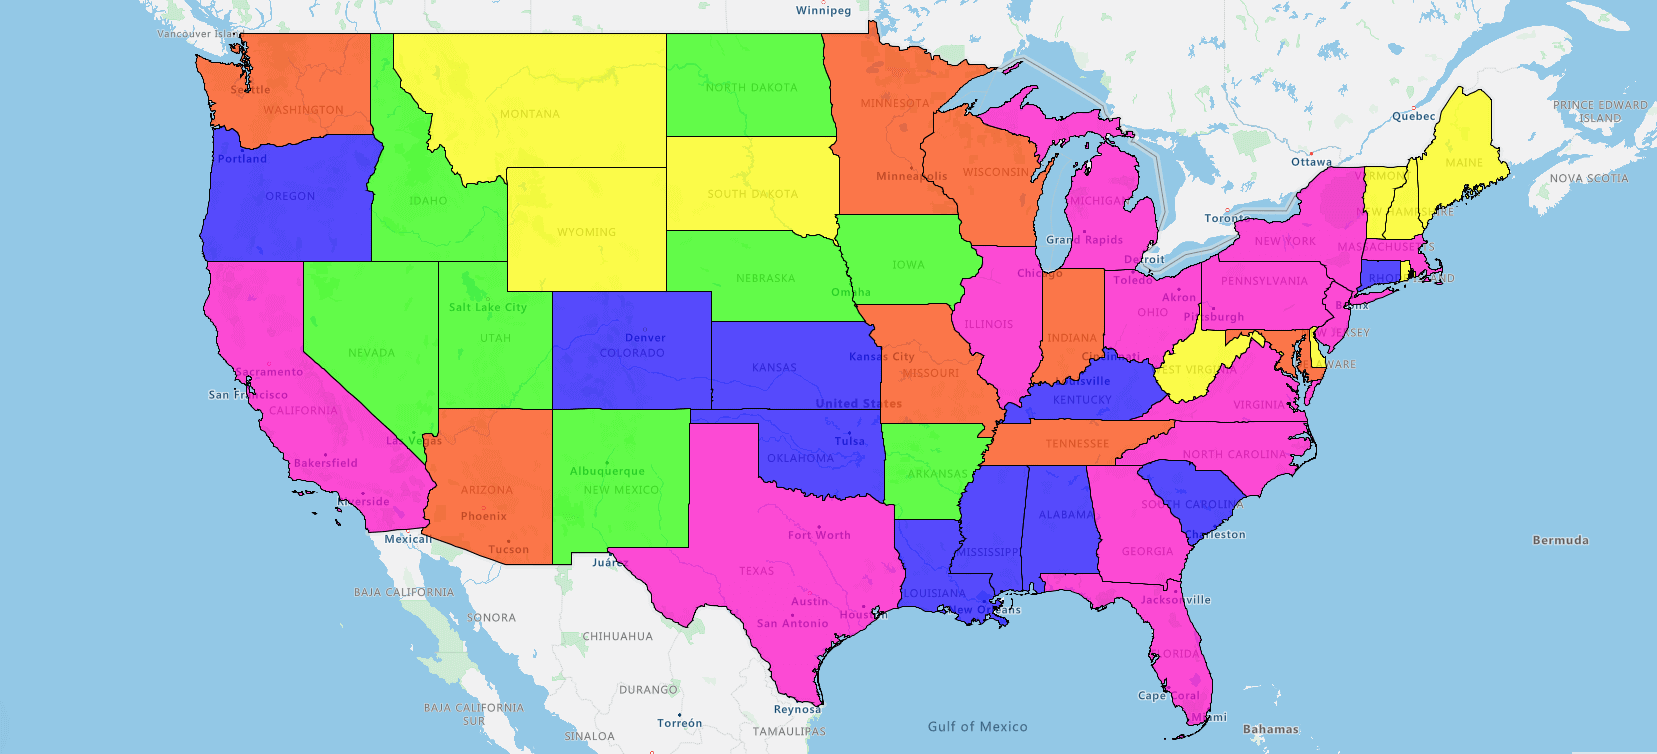
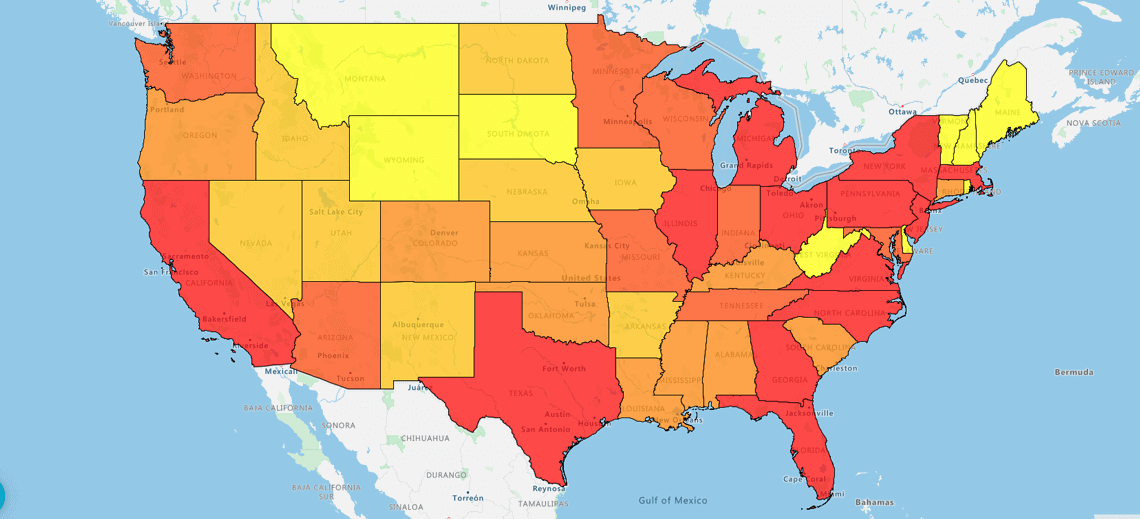
A heat map, otherwise known as a choropleth map, displays data over a geographic area using different colors and shades to represent datasets. More than just a colored map, a geographical heat map can cover a small, specific area, or a large area, and helps visualize data points in each included region of the map based on color.
A commonly cited example of a heat map is a simple population data visualization. You will have seen a map like this for a particular country, region or the entire globe. Darker shades of color represent areas of higher population density, and cooler or lighter colors are used for less-populated parts.
Here are some of the ways sales teams apply this basic idea to their own data:
- Sales territory mapping: In the context of an enterprise sales team, heat maps can be a powerful tool for territory mapping, where the geographic area of the map covers your sales teams' assigned territories. The color scale can then show customer density in particular areas, or even how often sales reps engage or visit these customers.
- A bird's eye view of market performance: Building on territory mapping, a geographic heat map can also provide a robust, yet easy-to-use tool to view your team's performance in a specific geographic market area. For instance, if your sales are centered around several northeast towns in your state, a heat map can show both high-performing and low-performing areas. Using this data, you can better target the cooler-colored, or lower density, areas that your team may not have focused on in the past.
- See where your top customers are: Similarly, a geographic heat map can easily highlight the locations of your top customers, and even help you spot clusters of customers that might have resulted from a sales campaign targeted in a specific area. Viewing your customer clusters can also help you learn more about your top clients, and help you identify other potential customers in the same region.
- Track specific product sales in certain areas: In addition to providing a wealth of information about customers and their locations, a geographic heat map is also useful for tracking sales patterns. This includes trends pertaining to specific products. Using a geographic heat map, you might notice that customers situated in southern areas are purchasing high volumes of a certain product. With this data, you can further support your "hot spots" while also targeting other opportunities outside of that high-performing sales area.
Types of maps: Regional geographic heat map
A dedicated enterprise mapping tool like eSpatial enables you to create two distinct types of heat map, depending on the use case you might have in mind.
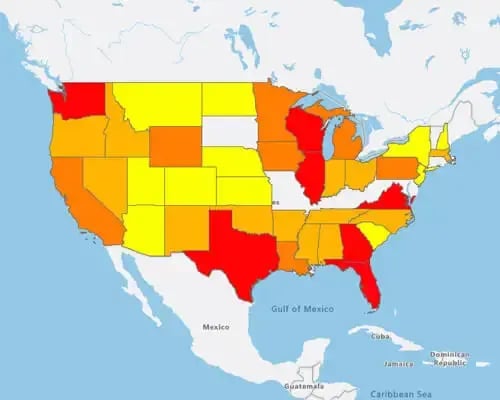
A regional heat map includes solid areas of color, and based on the shade, you can visualize data such as the volume of sales completed in a specific area or state, the number of customers in each area, or a range of other designations. These maps are highly customizable, and can include a smaller area or a large region, with a color scale representing different value ranges.
Hot spot geographic heat map
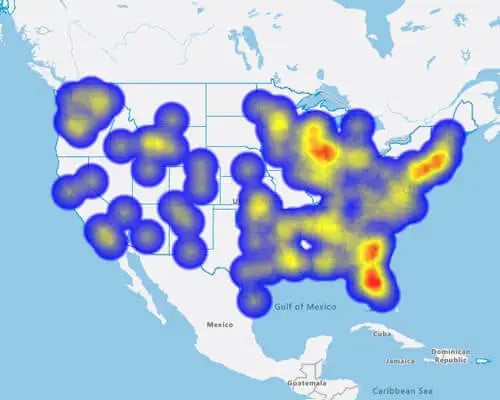
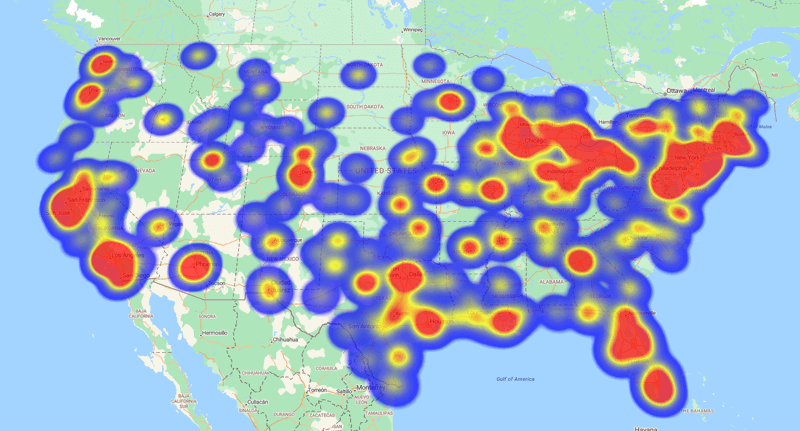
A hot spot heat map, on the other hand, is just as it sounds – as opposed to regions being color-coded according to certain values, this type of map helps better highlight each hot spot in your data. Higher volumes or levels (depending on the data used for the map) are expressed in darker colors, and as these volumes lower, the colors become lighter.
Just like the regional heat map, hot spot maps are very flexible and customizable, depending on the information used and the story that users want to display.
How to make a geographical heat map: Excel versus eSpatial
The possibilities and use cases for heat maps are limited only by your data (volume and quality) and the particular heat map generator you choose. From plotting out sales territories to tracking planning new product launches, regional and hot spot geographic heat maps can be useful in lots of different ways.
Let's take a look at the process for creating these types of maps in both Excel and eSpatial.
Excel map charts
Microsoft calls this capability "map charts", and enables users to download a workbook with some examples. However, the process does have some limitations.
First, users must use the "Data" tab's "Geography" tool, where they can input their data into the available fields. Additional columns can be added, and users can include data like the country, state, county, city and postal code of the locations they'd like to display.
From there, you create the map chart from the "Insert" tab, where you navigate to "Filled Maps", and can see a preview of the map. Once the map is created, though, the process gets a bit complicated.
Next, you adjust the formatting and chart design of the map using the "Format Object" task pane. This provides options like the map projection, map area, map labels and colors that you might want to use.
Much of the data inputted requires context or guidance. Otherwise, you might end up with a blank map. If this happens, you have to go back and add another column to help better explain the data. Similarly, Excel cannot support street address mapping — just high-level geographic data. This means maps may not be as detailed or dimensional as you need.

eSpatial geographic heat maps
While maps are just one small feature of Excel, maps are what eSpatial was built for. When it comes to heat mapping, eSpatial is an intuitive and simple tool allowing you to create both regional and hot spot geographic heat maps.
Hot spot map
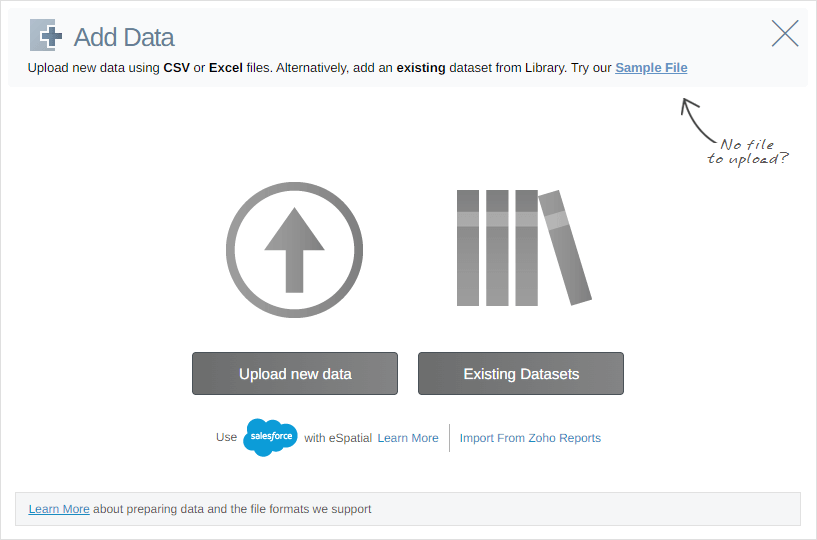
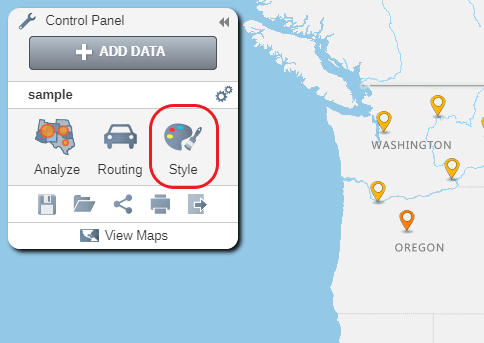
You can either upload your data directly from an existing Excel spreadsheet, or use the "Add Data" tool directly in eSpatial. From here, you leverage the Control Panel to choose the style of map you want to create, as well as the colors the map will display.
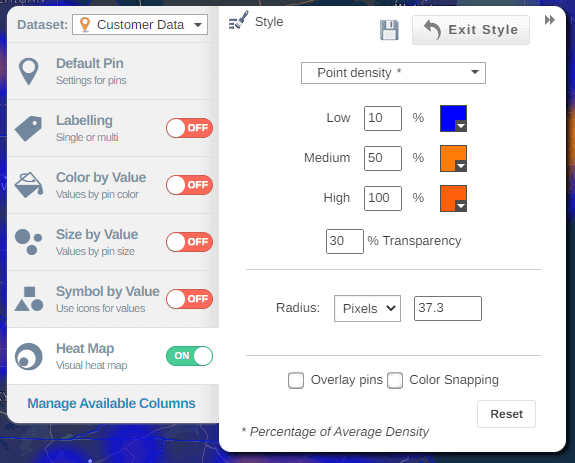
The Style and Color menu allows you to set specific values depending on their chosen colors, including thresholds for light or dark colors. You can even customize the transparency of your colors, to ensure that everything is visible and easy to understand. There is a toggle switch in this menu to turn on the visual heat map capability.
From here, you can include other optional features, including overlap pins or color snapping. Otherwise, simply provide a title, save the map to the eSpatial library and the process is complete.

Regional heat map
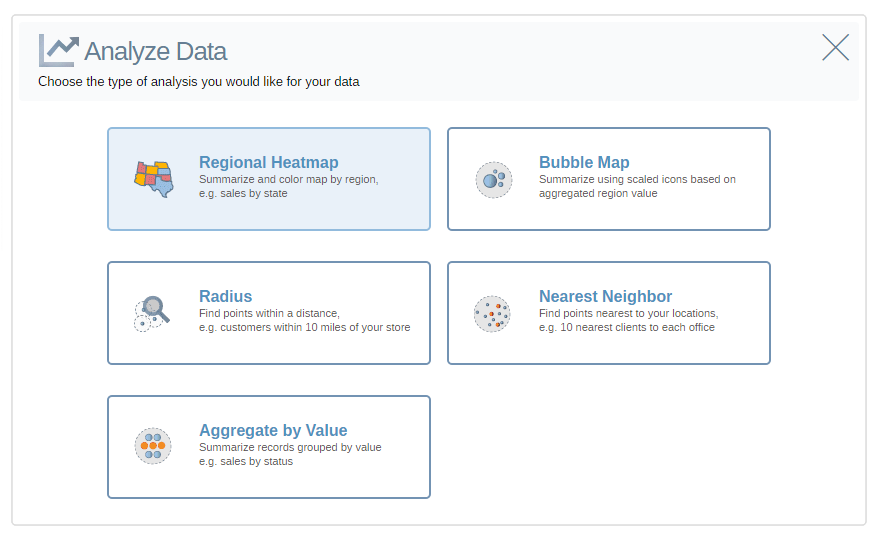
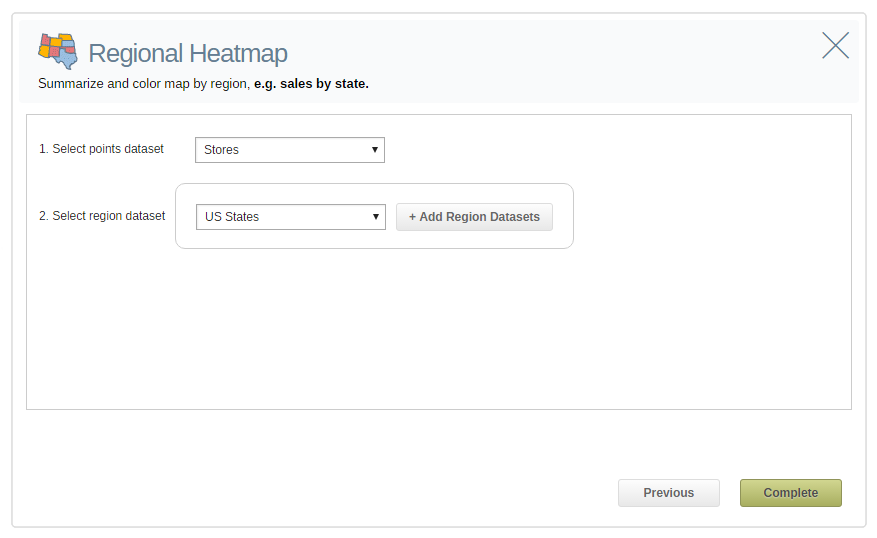
This type of map is similarly simple to create in eSpatial. After uploading data to the eSpatial platform, you click the Analyze button and select Regional Heatmap (this panel also enables other types of data analysis, such as bubble maps, aggregate value, radius and more).
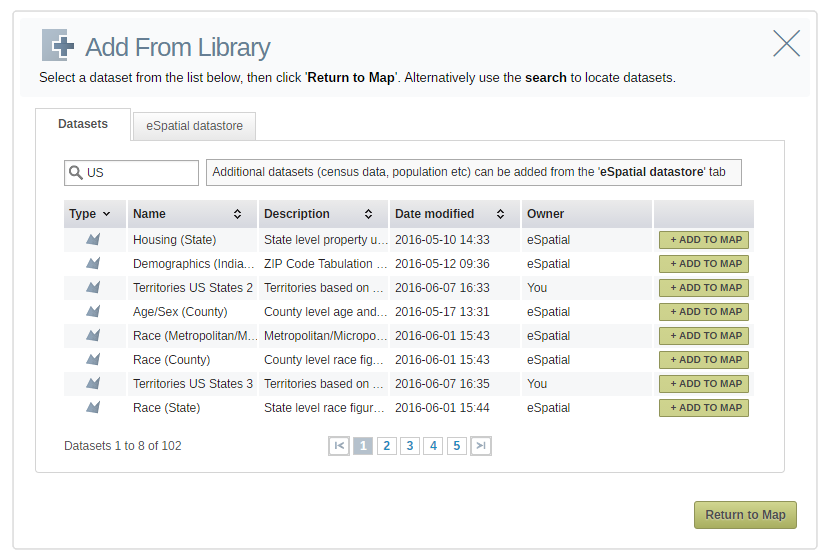
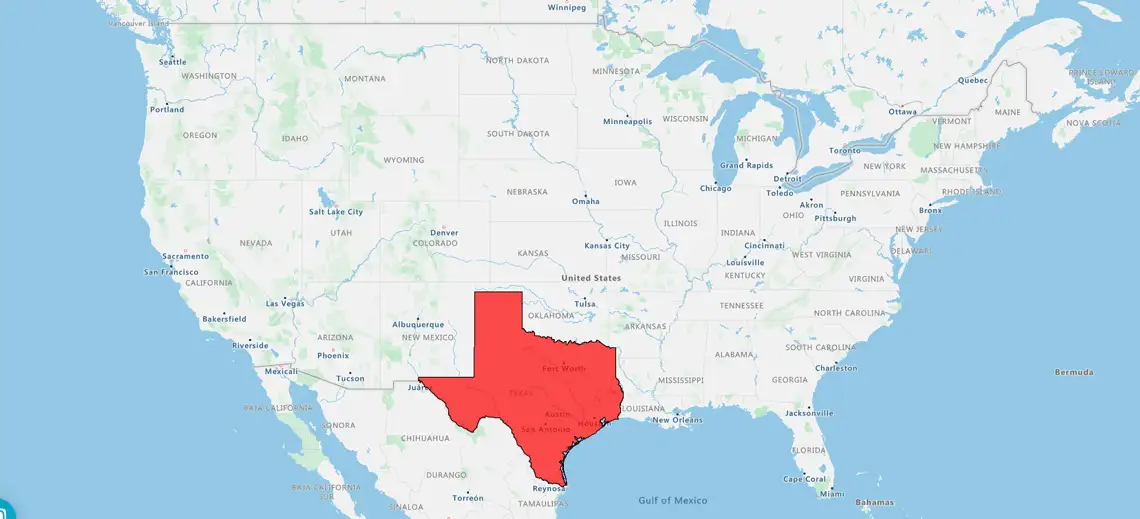
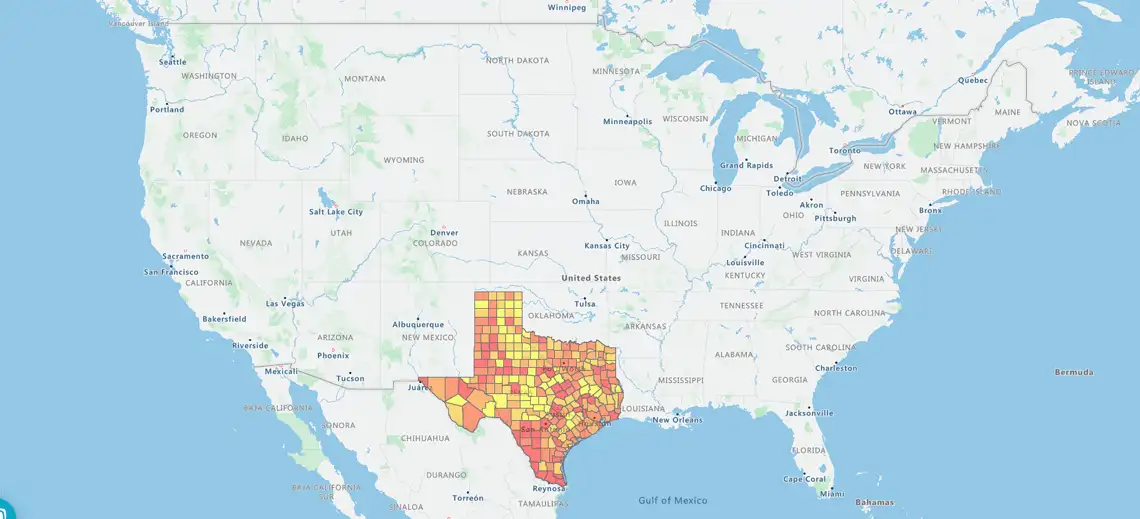
Next, you can adjust the boundaries of your map, through your own pre-built territory maps, or specific regions like certain states or countries. If you don't have your own datasets to plot in the regional map, you can use the eSpatial datastore and select from a range of third-party datasets.
Once the data and boundaries are set, simply click "Complete" and the map will generate.

Geographical heat mapping: Essential features
In addition to an intuitive and simple-to-understand user interface and experience, eSpatial offers some more key features for geographical heat mapping:
- The ability to use your own data, or a dataset from the eSpatial datastore. Even if you don't quite have your own regional dataset established, you can still use the heat mapping feature using an available dataset.
- Street address mapping. Whereas Excel doesn't support this, eSpatial enables you to plot out relevant street addresses, displayed as pins on regional heat maps.
- Simple sharing and publishing. eSpatial makes it easy to share and collaborate on geographic heat maps, so you can show this data to the entire team.
If Excel is limiting your heat mapping activities, you could benefit from a dedicated enterprise solution like eSpatial.
Connect with us or start a free trial today to check it out for yourself.