Establishing territories and salesperson assignments


Presented by Liam Costello and Ken Kramer

Liam Costello by Liam Costello  |  7 minute read
Try it for free

This is part two of our three-part series. Part one was Analyzing sales coverage and Geospatial data.

Fundamentals of Territory Alignment

  • Designing good territories
  • Best practices for designing territories using workload and capacity
  • Many of you are in the territory planning season, so hopefully, this is timely

1. What is territory optimization?

Territory optimization is a proven productivity strategy in which specific geographies and accounts are distributed to salespeople. It ensures that field-based teams work territories with an equal workload or level of sales opportunity. It maximizes revenue potential and resource allocation.

The outputs from territory optimization are often pushed to CRM ERP systems or form the basis of incentive compensation systems.

Note: if should include factors like:

  • Rep location
  • Travel time
  • Customer numbers or volume
  • Lead volume
  • Opportunity
  • Revenue
  • Call Frequency

Why is it valuable?

We would argue it is invaluable as it delivers upsides like:

  • Unlocks hidden revenue
  • Results in 4-12% more selling time
  • Reduces selling costs by up to 15%
  • Measures performance better and offers better insight
  • Your team win more sales and loses fewer
  • You maximize your resource allocation

Best practices

  1. Build territories from the ground up
  2. Use capacity as your primary value
  3. Create territories around your customers, not your rep locations
  4. Place reps in an optimal location
  5. Incorporate manager and local knowledge
  6. Measure the impact

2. Build territories from the ground up

Many organizations begin their design process by starting with a region or district. So, you could carve the US into four separate areas and assign a Vice President to each. And then begin carving up those regions into individual sales territories.

The constraints to creating balanced territories grow using this process. Typically, you could see ten well-balanced and two problematic areas in a region with twelve sales territories. We don't recommend that approach. A bottoms-up approach will deliver better results. So start by designing sales territories, then group them into districts, regions, etc. Use capacity as your primary value.

Sales rep coverage bar chart
North East territory is over-capacity, North West Central is under-capacity

We recommend you use a workload index, which includes Call frequency (how often a rep calls the customer), call duration (how long a representative spends in a sales call) and travel time (with eSpatial, the travel time is calculated by the software).

Using the workload index, you will end up with balanced territories. Create territories around customers, not rep locations.

Hotspot heatmap analysis

The map above shows hotspots representing customer concentrations:

  • The red areas show you the highest concentrations of customers (New York, Philadelphia)
  • Rep locations are the green person icons.
  • There is a rep located in Bloomsburg, but as you'll note, it could be better as it is not close to customers.
Pin map proximity analysis

The image above shows clearly that Gill's drive time (or windshield time) will be significantly higher than Simone's or Rosalyn's. That is avoidable with a "weighted center" approach to rep locations.

3. Place reps in an optimal location

Sales territories with no weighted centers

In the real world, it is hard to undo rep location choice, but as some of your team leave or if you grow, opportunities can arise that are favorable to a change. The image above shows two sales territories (Pennsylvania 1 and 2).

Using a workload index and calculating rep capacity, it was decided to create an additional sales territory (New Jersey 2)

Sales territories with weighted centers

Using the logic of a "weighted center" or the best location for a rep based on customer concentrations, we plot the ideal place for a representative in red circles. The image shows in striking detail the value of locating your reps near customers. If a rep lived in Williamsport (in Pennsylvania 1), the travel time involved in servicing customers would be prohibitive.

Sales territories with weighted centers zoomed in

By zooming the image above, you get a better visual of the ideal locations for your reps.

4. Incorporate manager and local knowledge

Nobody knows your business like your local sales managers, reps or regional managers. We recommend you start with territory mapping software and leverage the power of territory optimization. But, before you make any final decisions, talk to the team who have the local knowledge.

You want to avoid disruption like a rep's anger because they lost a favorite customer—or a customer's anger because they had a strong relationship with their existing rep and didn't want change.

Account exceptions map

It often makes sense to make "account exceptions". The image above shows Territory 3 and Territory 8 (in green). Some "account exceptions" are represented by green circles in Territory 3. So, the rep for Territory 8 retains ownership over those accounts even though they are in a different geographical territory.

The feedback from the manager was crucial in making that adjustment and protecting an important customer relationship.

5. Measure the impact

To improve your territory management process, it is essential to measure the return or impact of your changes on:

  • Workload by rep
  • Revenue by sales territory
  • Revenue growth year-on-year
Sales territory comparison tool for scenario planning

The image above shows the eSpatial comparison tool, which shows a realignment's impact.

On the left is the original region with nine territories. On the right is the newly optimized alignment with ten territories.

The table shows the ideal workload as an orange dotted line. And the dark blue blocks show you that the new alignments are as close to ideal as you would desire. Sharing scenarios with your team enables you to get feedback before you finalize your plans.

Territory map by value

You can use a Regional heat map like the one above to show your territory performance. The territories in RED need to be performing better. Visualizing your territory performance on a map is much better than using an Excel sheet.

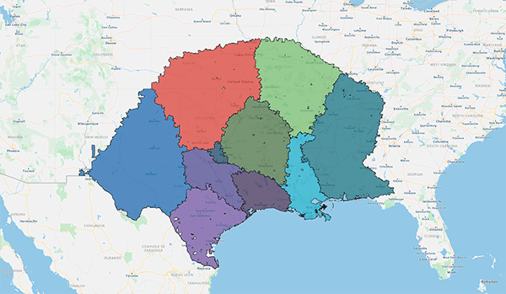
The first quick win for us was that eSpatial was so easy to use. After using so many other applications, eSpatial was the easiest for importing our data and identifying the fields and hierarchies that would deliver efficient alignments. At the end of the day, you are finalizing the sales territory in front of their eyes. It is much more real to the key stakeholders, which has been transformational for Thermo Fisher.

Jamie Baker

Director of sales, Thermo Fisher Scientific


Liam Costello Written by

Liam Costello

Liam is an eSpatial account manager and mapping expert. He specializes in helping businesses solve problems and increase sales through mapping visualization, territory management, route optimization and more. Liam holds a Master's Degree in Geographical Information Systems (GIS) and Remote Sensing.

Read more from Liam Costello