
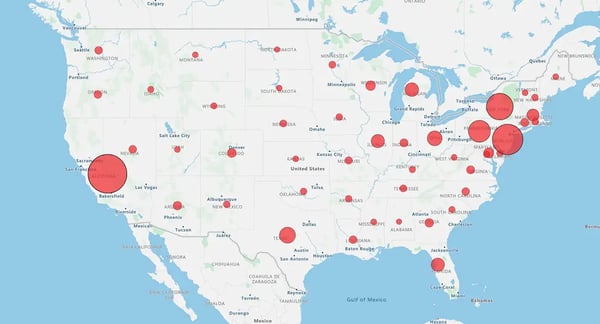
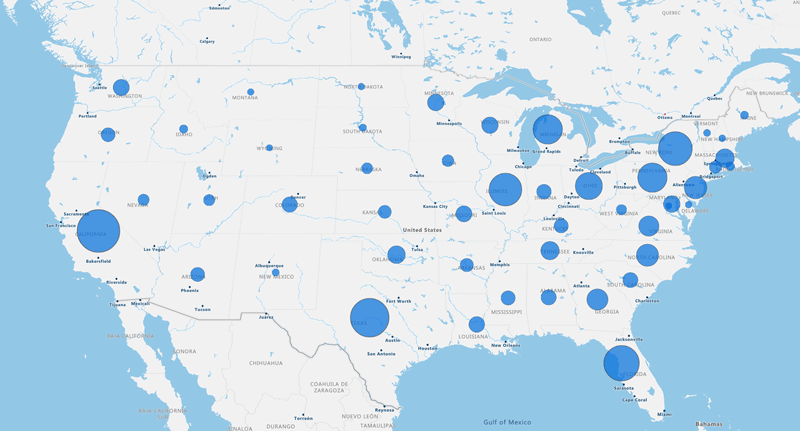
Cluster mapping—also known as bubble or density mapping—uses proportional symbols to visualize exactly where your data concentrates.
How it works: It groups data points (like customers or sales volume) into bubbles. The bigger the bubble, the higher the density or metric. It exposes relationships that spreadsheets hide.
- Spot patterns: See instantly how neighborhoods or entities relate
- Target precision: Use heat maps to identify sales hotspots by postcode and uncover new markets near population centres
Low concentration
High concentration
- Visualize the invisible: Spreadsheets hide relationships. Maps reveal them. Spot dense customer pockets or critical outliers instantly to target resources where they count.
- Segment by location: Don't just guess—know. Group customers by geography and shared traits (like spending habits). Use these natural segments to tailor your sales pitch with precision.
- Spot expansion gaps: Identify underserved regions where customer clusters form but coverage lags. If the map shows heat but no reps, it's time to assign resources.
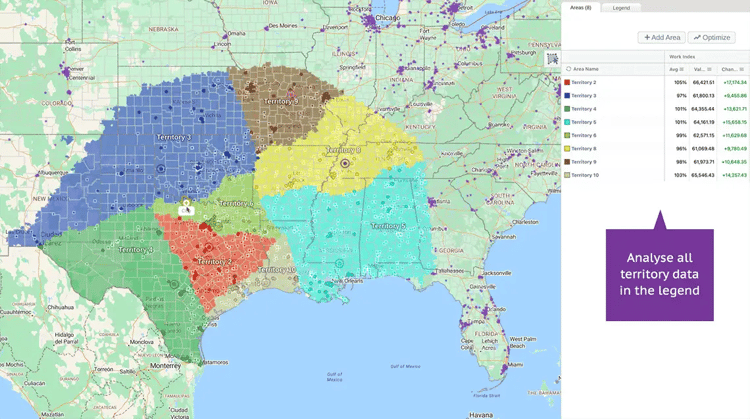
- Optimize territories: Balance the load. Visualize account concentration to fix coverage imbalances. Ensure every territory is designed for maximum performance, not just equal square mileage.
- Decode regional behavior: Buying patterns shift across borders. Use location intelligence to distinguish urban vs. rural needs, then adjust your product focus and messaging accordingly.
- Spark innovation: Find the white space. Dense, unmet demand outside your current footprint signals opportunity for new business models or retail locations.
- Decide with context: Context is king. Layering spatial data over complex metrics turns abstract numbers into clear priorities, helping you evaluate rep performance and market density faster.
Sales territory mapping software visualizes data density, revealing insights that spreadsheets miss. Use it to optimize territories and analyze customer behavior fast.
The Process
- Gather and clean: Centralize address-level data in a single spreadsheet. Ensure consistent formatting for City, State, and ZIP to prevent errors.
- Define the goal: Know your "why" before you map. Are you identifying expansion zones, balancing workloads, or analyzing supply and demand?
- Leverage algorithms: eSpatial embeds advanced analysis (like K-Means clustering) into the interface, so you can group data points without writing code.
- Build the map: Upload your dataset and select "cluster map." Adjust colors, sizes, and labels to make the data easy to scan.
- Assign and sync: Create territory zones using ZIP codes or counties. Auto-fill gaps to balance workloads, then sync the final map to your CRM for real-time collaboration.
- Analyze and iterate: Review the map to spot outliers and trends. Use interactive search tools to refine your strategy as the market shifts.
eSpatial drives smarter decisions across industries by visualizing data density.
Real-World Wins
- Retail: Visualize high-spender concentrations to target marketing
- Healthcare: Map patient locations against visit frequency to optimize care
- B2B: Align sales rep coverage with actual account density
- Telecom: Target network upgrades by mapping service complaint clusters
- Franchises: Identify lookalike audiences in untapped cities for expansion
eSpatial transforms raw data into optimized territories, efficient routes, and targeted campaigns—directly within your current workflow.
Pick from the eSpatial pricing plan a plan that fits your needs and unlock the power of location intelligence today.