Quick answer
Sales coverage analysis, supported by geospatial data, is a strategic method to ensure sales territories are designed for maximum revenue and efficiency.
Key takeaways:
- Assess territories: Evaluate sales territories geographically and mathematically to ensure fair workload distribution
- Identify gaps: Use proximity analysis to find areas with unassigned customers or where reps have difficulty reaching clients
- Find growth opportunities: Use heatmap analysis to pinpoint "whitespaces" or new areas with high potential for sales growth
- Boost performance: Maximize the potential of every sales rep by providing them with a well-designed territory, leading to happier customers and more deals
As part of a 3-part series working with the SMA (Sales Management Association), Ken Kramer and Liam Costello cover topics like:
- Analyzing sales coverage using geospatial data
- Establishing territories and salesperson assignments
- Route planning and call scheduling
In this article, we cover the highlights of the webinar:
- What is sales coverage/analytics?
- Benefits of correct sales coverage
- Sales coverage best practices
1. What is Sales Coverage/analytics?
When thinking about sales coverage, you assess:
- The service levels for customers and prospects
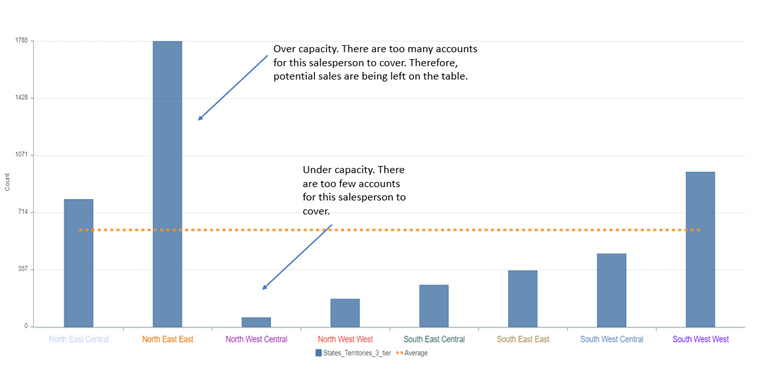
- The performance of sales territories: are they under or over-performing
- What's causing the over or under-performance
- Sales rep performance variances
- Sales rep workloads. Is the effort required to service customers and prospects in balance?
You will also include factors like:
- A rep's location
- Customer and prospect locations
- Call frequency (how often you will call on or service customers)
- Drivetime (how long does it take to travel to customer locations)
The problem
Revenue is an important KPI for sales managers and reps. Sales compensation is often linked to revenue goals. It makes sense, but how often do sales reps hit quota because of their sales territory design? They struck gold because their territory had so much sales potential it was easy to succeed.
We frequently hear from customers who say, "I cannot get a good Rep who will hit quota". But the sales territory was set up for failure. How? It lacks enough sales potential to be a thriving area.
It is not a people problem but a sales coverage problem.
2. Benefits of Correct Sales Coverage
When you design your sales coverage to maximize sales potential for all of your sales reps, you end up with
- Happier customers (they get better service levels)
- Efficient workloads, which means more visits (more visits means more deals)
- Fewer sales left on the table (you virtually eliminate inefficiencies and lost revenue potential)
- Easily identify whitespaces (new areas of potential sales growth)
3. Sales Coverage Best Practices
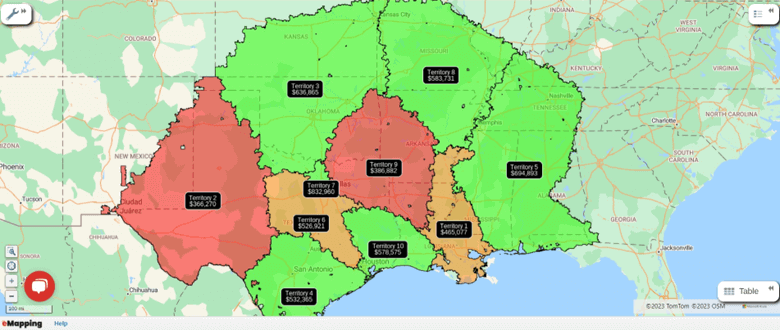
Review your coverage geographically and mathematically
Use territory mapping software to visualize your sales territory performance.
Conduct proximity analysis
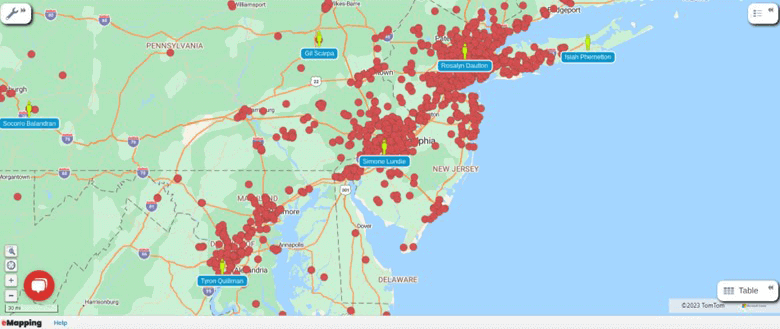
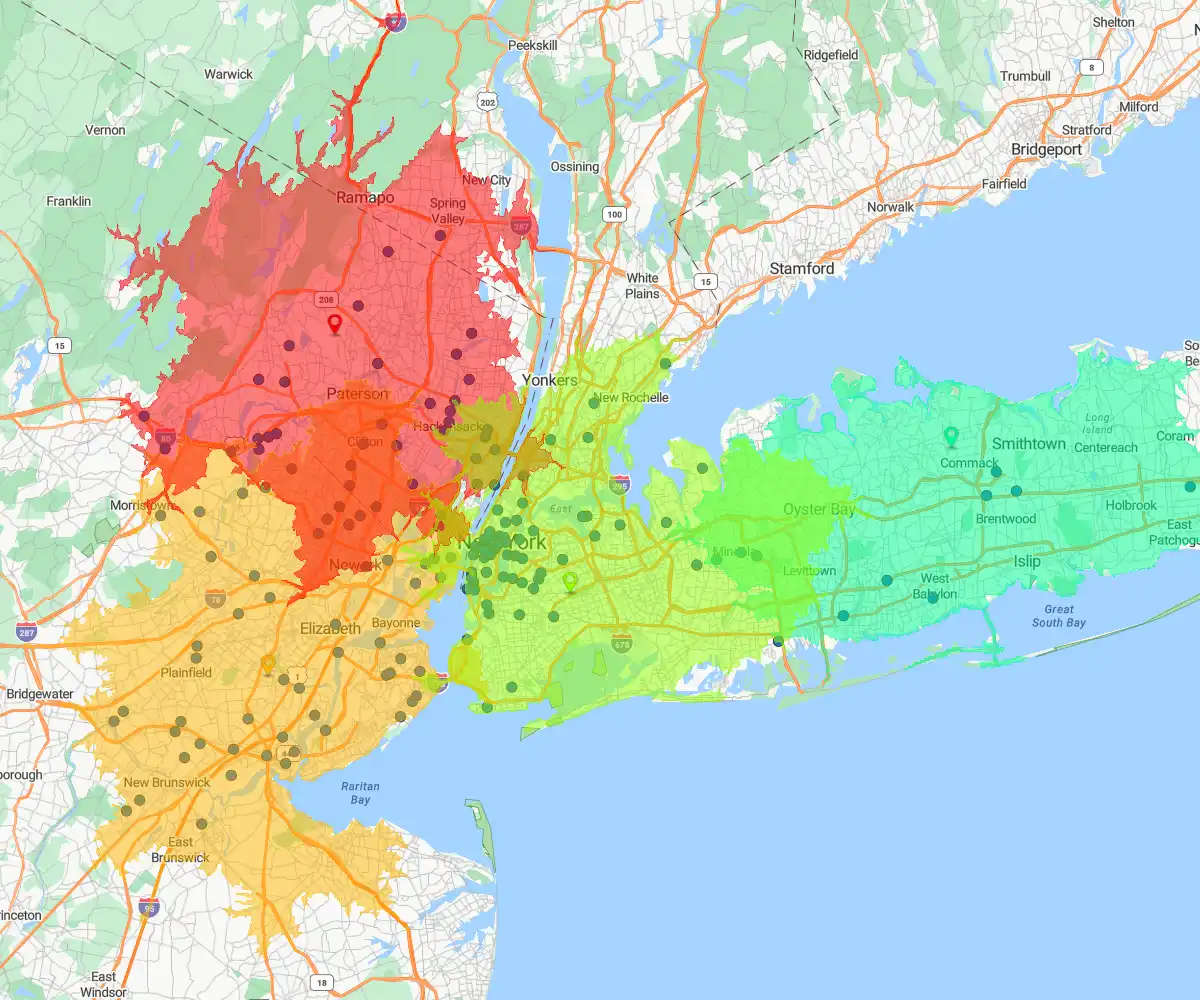
With the right mapping software, you can quickly see issues requiring more analysis. You can analyze your coverage within and outside the buffer using a drivetime buffer and setting a 60-minute drivetime window.
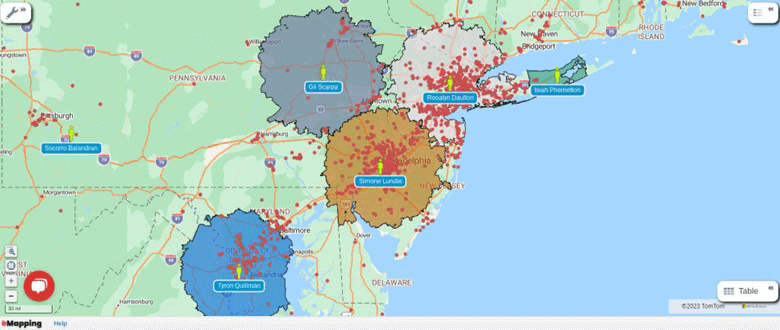
With the visual intelligence of a map, you can make some resource allocation choices. Do you hire more people to service those areas outside the one-hour drive time?
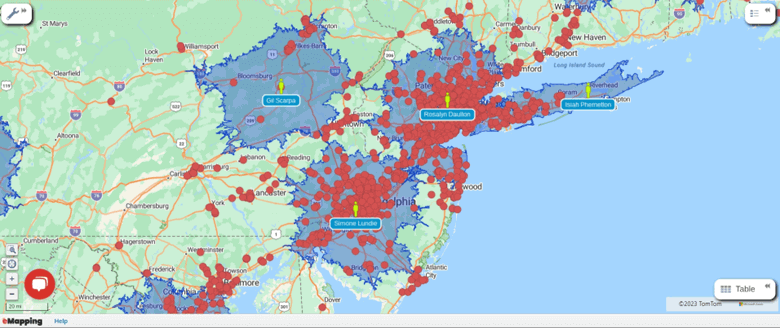
Establish customer count/value outside coverage areas

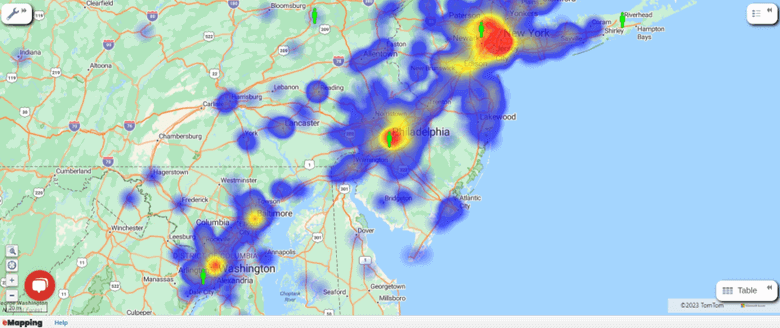
Carry out hotspot heatmap analysis to find new areas to target
Hotspot heat maps are invaluable in your sales coverage assessments. Using the map, you can:
- See whitespaces (potential new growth areas)
- Assess rep coverage (is our coverage adequate for our customer and prospect numbers and locations)
- Are there trends in my data that signal the expansion or contraction of our sales resources?
All the images above have leveraged internal sales data, but you can import industry-specific datasets and demographic datasets to improve your analysis and decisions.
Sales data can be mapped in minutes. That has saved us countless numbers of hours. And we have eliminated steps from the design and approvals process leading to faster more efficient alignments in less time.
Sarah Kirmani
Operations Manager


