|
The Growth Struggle |
The eSpatial Advantage |
|---|---|
|
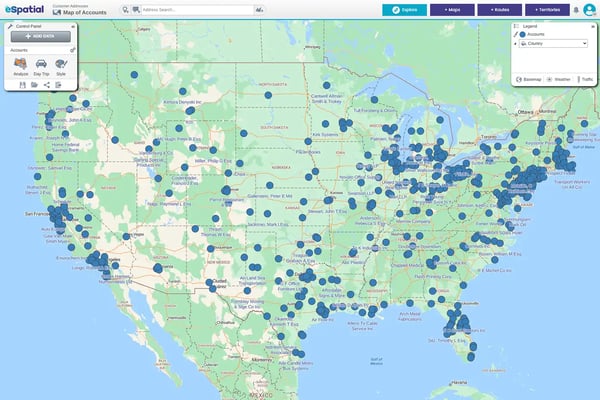
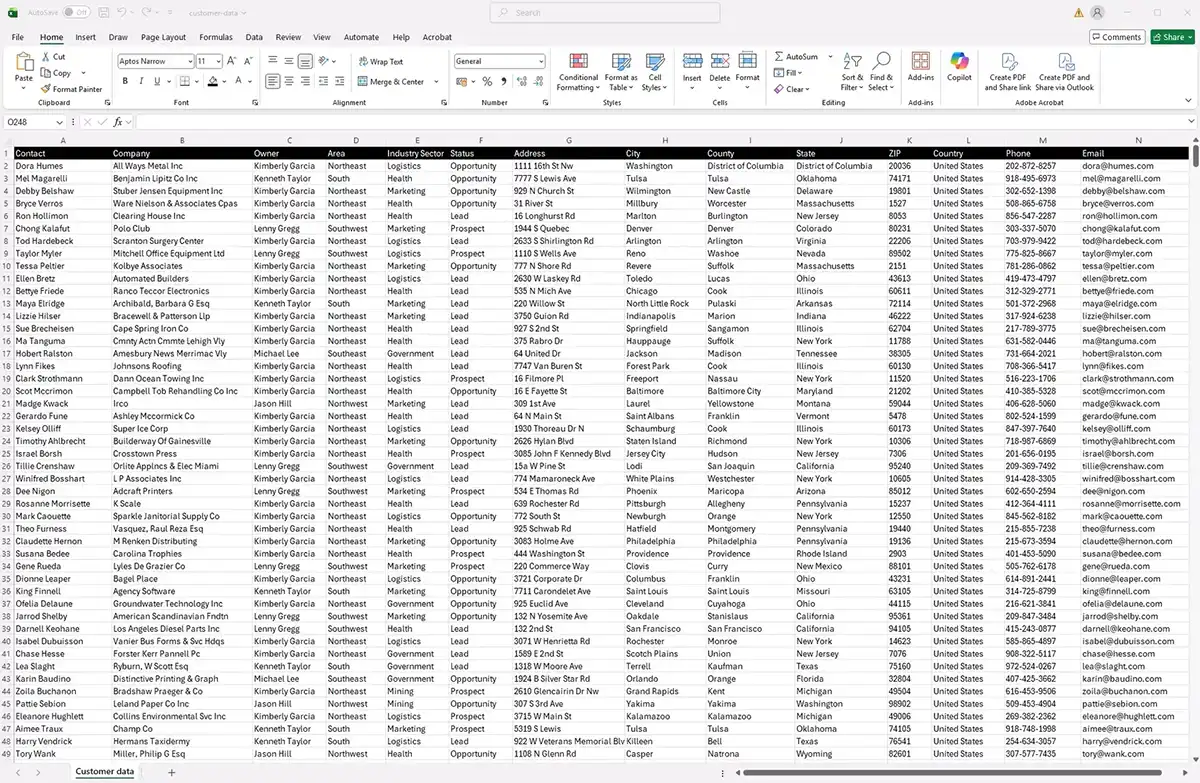
Data Blindness: Scrolling through rows of sales data makes it impossible to see geographic market penetration or hidden "white space". |
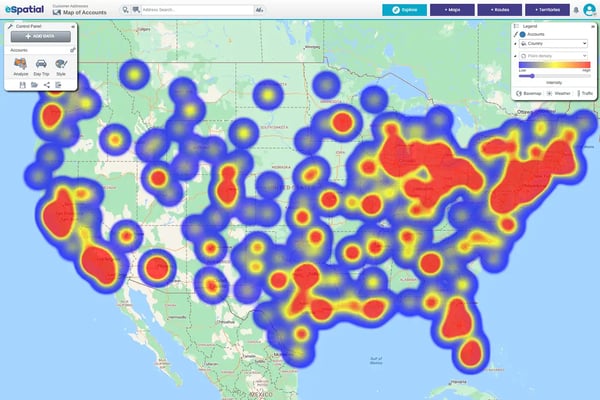
Geospatial Analysis: Heat maps and market mapping tools provide immediate visual proof of high-density revenue zones and untapped markets. |
|
Academic GIS Complexity: Legacy mapping tools require a steep learning curve, specialized GIS staff, and days of work to build a simple choropleth map. |
Automated Insights: Sync your CRM data to generate business-focused thematic maps and spatial trend analysis in seconds, no coding required. |
|
Subjective Strategy: "I feel like our presence in the Midwest is strong enough to hold off competitors. Let's look South". |
Objective Validation: "Our geographic data analysis reveals a 30% market gap in the Chicago metro area, representing a prime expansion zone". |
Unlock Market Growth: Tools for
Strategic Geographic Analysis

1. Spotting the White Space with Heat Maps
Where is your next million dollars hiding? Untapped revenue doesn't shout, it hides in the gaps between your current customers.
eSpatial's market analysis mapping software translates dense customer data into high-contrast heat maps:
- Easily identify high-yield revenue zones
- Perform immediate white space analysis
- Stop sending reps into saturated markets
Target the geographic areas where market potential is high, but your penetration is low, allowing you to accelerate market growth with a purely data-driven strategy.

2. ZIP Code and Postcode Analysis
Zoom in on regional health. National trends often mask local failures. By mapping key metrics to specific ZIP code or postal boundaries, you can perform deep spatial data analysis to see exactly which areas are underperforming.
- Instantly spot performance anomalies
- Conduct market gap analysis
- Align your field marketing and sales resources precisely where the data dictates
Rather than blanketing an entire state. Aggregating data at the postal level turns millions of disjointed records into a cohesive geographic strategy.

3. Choropleth and Thematic Trends
Forget complex, academic GIS jargon. For business leaders, a thematic map (often called a choropleth map) is the ultimate C-Suite communication tool.
It shades geographic regions like states, counties, or custom sales territories based on data values, such as total revenue or demographic density. This immediate visual contrast provides:
- An instant summary of spatial trend analysis
- The perfect visual aid to validate where your next office, territory, or campaign should launch
It shifts the conversation from "what is a choropleth map?" to "how do we capture this new territory?"
Industry Spotlight: Identifying
Gaps & Growth Trends

Stop guessing where your next clinic belongs. Most healthcare leaders rely on spreadsheets that hide the truth about patient access . eSpatial turns that data into a clear story, allowing you to validate that 70% of employees are within a 10-mile radius of your care.
Whether you are identifying service gaps or presenting a winning Request for Proposal (RFP), we give you the visual proof needed to expand with confidence and close more business.

No more board presentations with spreadsheets. Start sparking real strategy. Community banks use eSpatial to transform dense financial data into visual insights that actually drive profitability.
By layering branch locations with demographic and customer analytics, leaders have created strategic maps to identify new branch opportunities and areas for consolidation.
It is time to ditch "dated" mapping for a fresh, professional output that wows executive management and turns numbers into actionable growth.

Turn days of reporting into 20 minutes of high-impact visualization. In the engineering and HVAC space, performance visibility is the difference between a market leader and a laggard.
eSpatial allows regional managers to see the performance of hundreds of offices at a glance, cutting annual reporting time by an entire month.
Whether you are identifying coverage gaps or presenting complex market trends to the president, our tools make your data "come alive," ensuring you spend less time in the office and more time on business strategy.

Quit leaving money on the table at the job site. Your equipment is only valuable when it is in the right place at the right time. Our customers use eSpatial to bridge the gap between "gut feeling" and actual construction data, identifying $100,000’s in potential shipping savings by finding the most cost-effective plants.
Use these maps to challenge dealer perceptions, find gaps in your national coverage, and proactively target upcoming projects before the competition even knows they exist.

Optimize your workforce while the competition is still calculating. Managing 1,000+ sales reps across the country is a logistical nightmare without a visual guide. eSpatial helps staffing leaders strategically place talent and identify new office locations based on real market demand.
By optimizing your office assignments and reducing travel time, you stop wasting fuel and start driving the operational efficiency that leads to increased revenue.

Take the driver's seat in your sales process. Relying on distributors to bring you leads is a passive way to grow. Innovative manufacturers use eSpatial to gain full visibility over end customers, allowing sales reps to spend 30% more time selling and 67% less time onboarding. By mapping your install base and identifying underserved territories, you can ensure your technicians and sales reps are positioned exactly where the revenue is.
Mapping Software Solutions
-
 Reporting & Visualization
Tell a data story the boardroom understands. Generate presentation-ready, color-coded, and radius maps from your data instantly.
-
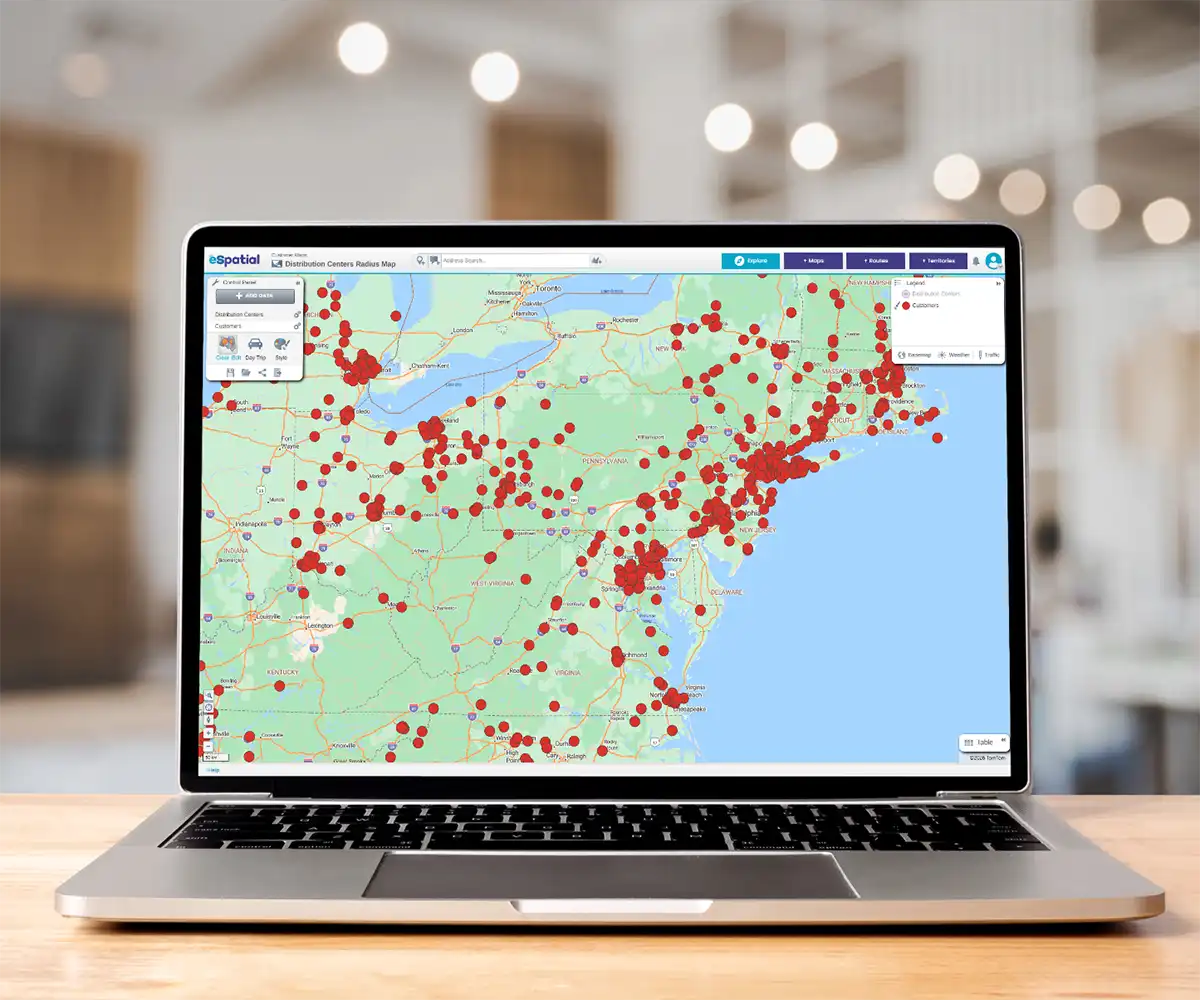 Strategic Location Decisions
Align physical assets with demand. Map workforce locations securely, optimize site selection, and mitigate risk with proximity analysis.
-
 Sales Productivity
Give reps back 5 hours a week. Natively map your CRM data to visually cluster high-value accounts and analyze your sales pipeline.