



4.8/5 of 53 reviews
4.3/5 of 38 reviews

Marketer's Guide to Winning With Mapping Software: Closing the Visual Gap


Eliminate data blind spots, drive regional campaign ROI, and turn geographic insights into a strategic advantage for your entire marketing organization.

The Visual Intelligence Gap Why High-Tech Stacks Still Need Spatial Clarity


Laptop with charts and graphs

Today’s marketing leaders aren't short on analytical horsepower. You are likely running sophisticated stacks—tracking web attribution in GA4, monitoring market intent in SEO suites, slicing campaign data in Power BI, and leveraging advanced AI for predictive copy.

Yet, even with high-octane analytics, a crucial blind spot remains: data processing power is not the same as visual intelligence.

Power BI gives you bar graphs. GA4 gives you traffic funnels. Generative AI gives you text summaries. But when you need to answer spatial, real-world questions:

  • Where is our market density actually clustering?
  • Where are our competitors gaining ground?
  • Where is our ad spend overlapping with sales rep coverage?

Abstract charts force your brain to do heavy mental translation.

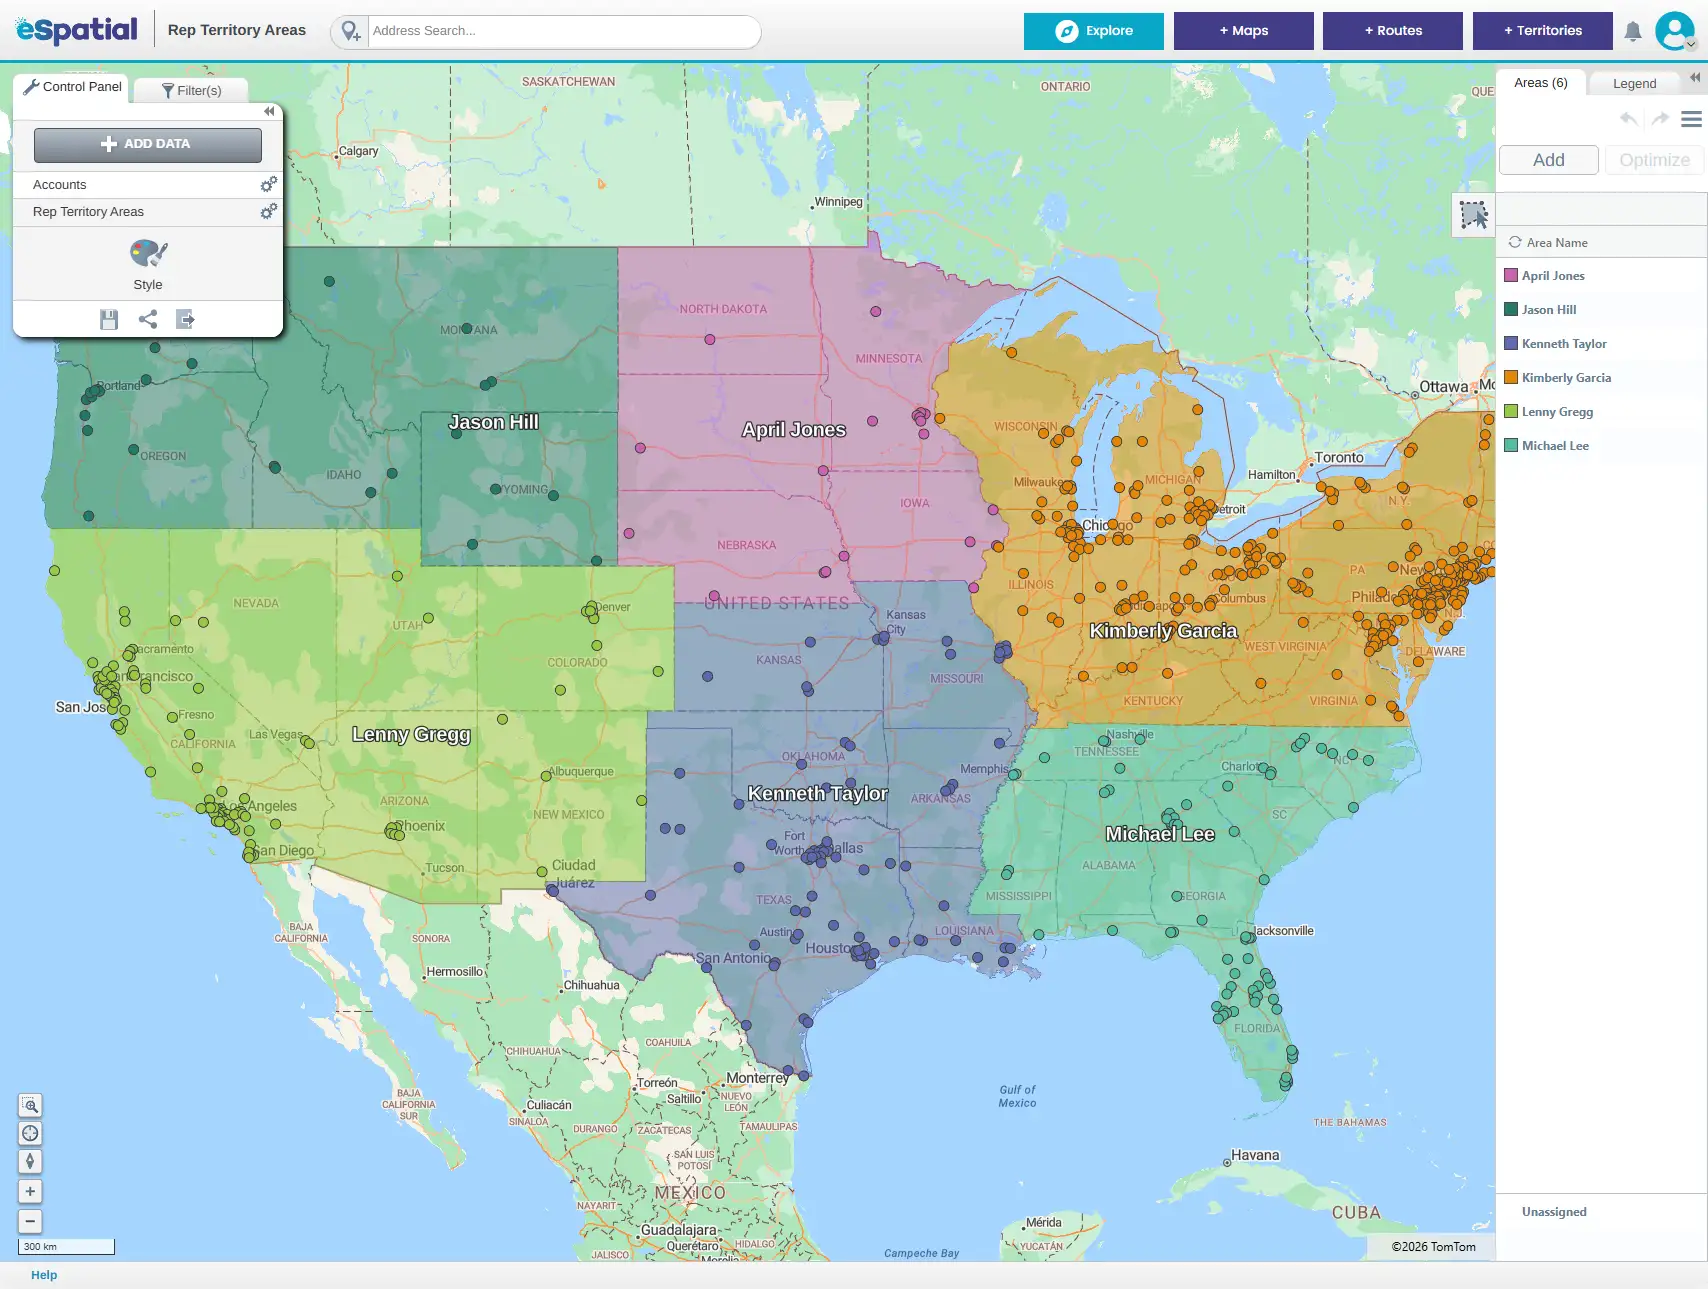
Maps leverage human spatial reasoning to turn abstract rows into an interactive visual engine. A map doesn't ask you to interpret numeric rows; it allows you to instantly see geographic patterns, connect hidden data points, and back your go-to-market strategy with clarity.

Metric / Capability

Advanced BI & Analytics Stack

Location Intelligence Engine

Data Representation

Abstract Metrics: Data is isolated into charts, tables, and numeric widgets.

Spatial Context: Customer data, sales boundaries, and campaign layers merge into one living map.

Cognitive Effort

High Cognitive Load: Requires mental translation to figure out where numerical trends physically live.

Instant Recognition: Geographic clusters, whitespaces, and density pop off the screen in seconds.

Scope of Insight

Siloed Insights: Tells you what happened across broad regions or digital channels.

Surgical Precision: Shows where physical execution, rep capacity, and market demand intersect.

Quick Win: Connect your mapping software directly to Salesforce via bi-directional syncing. Automated data ingestion eliminates manual spreadsheet formatting, allowing marketing teams to continuously visualize live customer records against sales territories.

The Marketing Value Framework & Strategic Use Cases From Visualization to Commercial Revenue Engine


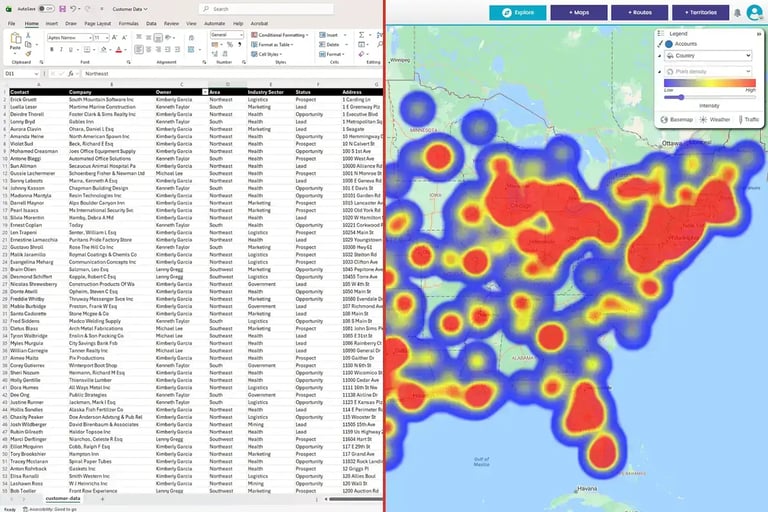
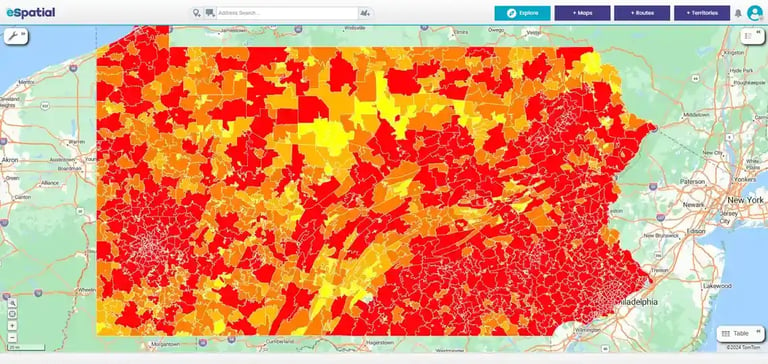
A regional heatmap or pin map is far more than a spatial graphic; it is a decision-support engine that translates complex market variables into commercial growth.

Spatial Capability

What You See

The Commercial Value Delivered

Density & Heat Mapping

Concentrations of high-value accounts, active leads, and market "dead zones".

Surgical Budget Allocation: Concentrate digital spend exclusively where account density is highest, cutting ad waste in cold regions.

Multi-Layer Data Mapping

Overlaid views of prospect clusters, competitor sites, rep locations, and supply depots.

Frictionless Campaign Orchestration: Coordinate campaign timing directly with local rep capacity and depot inventory.

Whitespace & Overlap Analysis

Underserved market territories and redundant marketing spend.

Uncapped Market Expansion: Pinpoint high-potential market gaps to capture market share before key competitors move in.

Interactive Spatial Maps

Dynamic visual scenario sharing instead of flat slide decks.

Rapid Executive Buy-In: Align instantly with CROs and Sales Ops by demonstrating the visual logic behind your strategy.

2 people reviewing regional heat map
Regional heat map

Surgical Geo-Targeting & Ad-Tech Integration

High-performing marketing teams move beyond broad state-level targeting.

By extracting custom polygon boundaries or postal code clusters directly from your heatmap analysis, you can export targeted account groups into digital channels like Google Ads geotargeting and LinkedIn Matched Audiences.

This prevents ad waste by ensuring digital dollars are spent strictly within active sales corridors.

Superglue being applied to screw thread
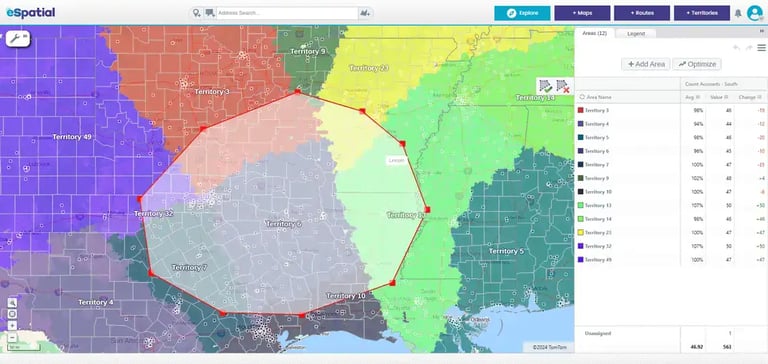
Editing territory map with lasso tool

New Product Launch Acceleration: Real-World Proof

A new product launch involves dozens of moving parts—from promotional spend and prospect targeting to sales enablement. Visual mapping arms sales teams with targeted prospect lists mapped directly by product line.

Henkel: By replacing passive distributor reliance with direct, map-based territory planning, Henkel's marketing and sales ops teams armed reps with targeted visual maps of verified prospects. This accelerated product adoption, cut new rep onboarding time by 67%, and reclaimed 30% of field selling time.

Team meeting review radius map
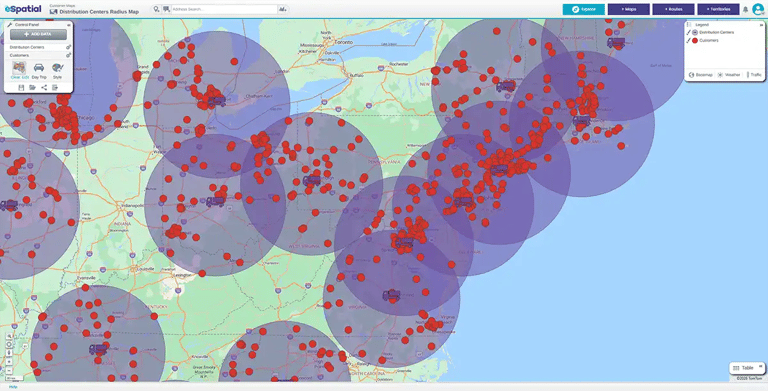
Pin map with radius overlay

Field Marketing & Event Planning Strategy

When organizing field roadshows, executive roundtables, or customer appreciation dinners, picking the wrong city leads to low attendance and wasted budget.

Spatial heatmaps allow marketing teams to layer customer density against prospect locations and airport accessibility. This pinpoints the exact ZIP code center that minimizes travel time for attendees, maximizing event turnout.

People working near heavy machinery
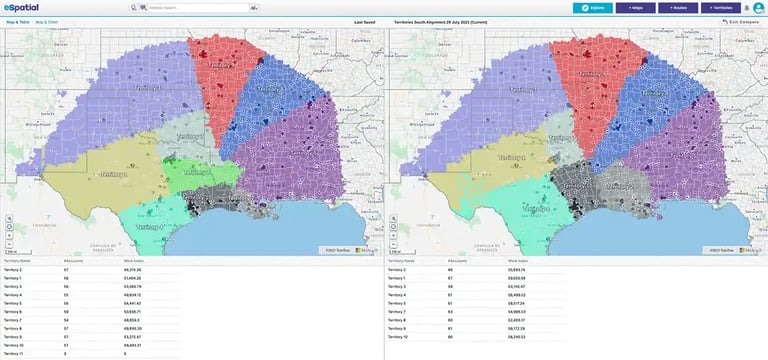
Territories before and after

Whitespace Capture & Revenue Activation

Abstract BI tables obscure market gaps. Visualizing customer density against sales boundaries instantly reveals unserviced account clusters.

Thermo Fisher Scientific: By deploying visual mapping to reorganize specialized sales units and analyze account coverage, Thermo Fisher eliminated territory blind spots and unlocked $30,000,000 in previously untapped sales potential.

The Marketer's Mapping Checklist


Map Type

GIS / Technical Term

Primary Marketing Application

Regional Heat Map / ZIP Code Map

Choropleth Map / Thematic Polygon Map

Aggregates campaign performance, market penetration, or revenue metrics into defined ZIP codes or regions to evaluate market coverage.

Hot Spot Heat Map

Kernel Density Estimation (KDE) Map

Visualizes continuous prospect and lead concentration across borderless gradients to identify exact geographic campaign focal points.

Account Value / Bubble Map

Proportional Symbol Map

Scales marker pins based on customer value or pipeline size, allowing marketers to visually prioritize high-value account clusters.

Drive-Time Buffer Map

Isochrone Map

Calculates realistic drive-time perimeters around event venues or field office locations using actual road networks rather than straight-line radius circles.

Account / Pin Map

Point Feature Map

Plots exact location coordinates for individual customer accounts, competitor locations, or retail locations on an interactive canvas.

Territory & Boundary Map

Spatial Partitioning Map

Overlays active sales territory boundaries directly onto marketing campaigns to verify sales rep coverage and capacity before lead generation begins.

Demographic Map

Thematic Map

Displays regional population density and socioeconomic data to evaluate demographic fit during market expansion planning.

Bridging the Gap Aligning Marketing Strategy with Field Realities


A brilliant marketing campaign fails the moment it hits an operational wall. When campaign planning happens in an analytical vacuum, you risk generating leads in regions where sales reps are overloaded, or driving campaigns where rep coverage is cold.

Stakeholder

Strategic Objective

The Alignment Friction

How Visual Mapping Bridges the Gap

Sales Operations Leaders

Build balanced territories and operational workflows.

Campaign leads drop into unbalanced or misaligned territory borders.

Seamless Lead Routing: Overlay marketing target lists directly onto live Salesforce territory boundaries.

VP of Sales & Field Leadership

Maximize quota attainment and rep productivity.

Reps are overwhelmed by leads outside their travel corridors.

Capacity-Matched Campaigns: Design campaigns around existing rep account clusters and drive-time radii.

Chief Revenue Officer (CRO)

Drive predictable revenue growth and market expansion.

Abstract lead generation metrics don't translate to top-line growth.

Office-to-Field Narrative: Present dynamic visual strategy maps to prove how marketing spend grows new revenue.

Person reviewing spreadsheet of data on a computer
Spreadsheet / hotspot heat map split

Live Stakeholder Consensus
& In-House Agility

A brilliant marketing campaign fails the moment it hits an operational wall. When campaign planning happens in an analytical vacuum, you risk generating leads in regions where sales reps are overloaded, or driving campaigns where rep coverage is cold.

  • LivaNova: Replaced hours of manual data formatting with digital map layers that load in minutes, allowing cross-functional sales and marketing teams to share secure interactive maps and streamline approvals.
  • Siemens: Slashed territory realignment cycles from weeks of spreadsheet modeling down to hours, ensuring reps operate in mathematically balanced workloads that protect selling time.
  • Global Pharmaceutical Enterprise: Replaced third-party vendor with eSpatial, saving nearly $1,000,000 in total value and eliminating $500/hour consulting fees while speeding up stakeholder alignment during regional planning.

The Marketing Buyer's Evaluation Checklist


When evaluating mapping software for a marketing organization, ensure the platform meets these essential operational criteria:

Ad-Tech Export Capabilities

Ability to easily export geographic clusters, ZIP codes, and custom polygon boundaries into digital marketing platforms (Google Ads, LinkedIn).

Multi-Layer
Mapping & Styling

Support for stacking multiple data layers (e.g., active accounts, prospects, competitor footprints, sales boundaries) on a single interactive view.

Advanced
Spatial Analytics

Built-in capability to generate heatmaps, proportional bubble maps, and asymmetrical drive-time buffers.

Interactive
Collaboration & Security

Secure map sharing, exportable boardroom reports, and live scenario modeling features to collaborate with Sales Ops and executives.

Human-First
Onboarding & Support

Dedicated onboarding specialists and customer support experts to ensure rapid team adoption without technical drag.

Salesforce
Integration

Bi-directional integration with Salesforce and flexible Excel/CSV file upload capabilities to map data in seconds without manual cleanup.

Platform Architecture & Product Tier Alignment


Selecting the right location intelligence configuration depends on your organization's operational complexity

Mapping Pro

Turn raw spreadsheet data into an interactive visual intelligence layer, delivering immediate answers to high-stakes geographic questions.

$499 per user per year Talk to Sales 475 per user per year (€584.25 Inc VAT) Talk to Sales £435 per user per year Talk to Sales

Minimum 3 users

Every map you’ll ever need
for more confident decisions

  • Instant Data MappingMap your data in seconds from Excel, Salesforce, and more with heat mapping and pin maps.
  • Advanced Gaps & HotspotsIdentify key revenue opportunities, market trends, and hidden business gaps with visual spatial intelligence.
  • Risk & Decision AnalysisEvaluate sales performance and risks across territories and regions for smarter, data-driven decisions.
  • Boardroom-Ready ReportsPresent compelling spatial insights to leadership and teams with high-impact visuals and easy sharing.
  • Country DatasetsUS, Canada, and UK boundary datasets included.
Buy now Contact sales

Advanced Territory Manager

Drive daily operations with continuous, automated territory optimization and predictive modeling.

$4,999 per user per year Talk to Sales 4,749 per user per year (€5,841.27 Inc VAT) Talk to Sales £4,349 per user per year Talk to Sales

Minimum 3 users

Everything in Professional
Territory Manager Plus:

  • Automated Territory OptimizationAutomatically balance territories based on live sales or business data, complex workload constraints, and changing revenue potential.
  • Predictive "What-If" Scenario ModelingSafely model and compare complex organizational shifts or market expansions side-by-side before disrupting live operations.
  • Build Scale & HierarchiesManage up to 6 levels of sales organization hierarchy with full data synchronization to ensure a single, consistent source of truth across global or national teams.
  • Predictive Performance InsightsModel complex organizational changes to drive a revenue lift through perfect market coverage.
Contact sales Contact sales

Proving Marketing ROI & C-Suite Execution


To secure budget for regional initiatives, marketing leaders must present data stories that connect campaign spend to concrete commercial metrics:

Regional Cost Per Acquisition (CPA) Reduction

Focus ad spend strictly on verified account clusters to eliminate ad impressions in unproductive geographic zones.

Lead-to-Opportunity Velocity

Ensure every lead generated falls within active sales territory boundaries for immediate rep follow-up.

Local Conversion Lift

Coordinate field marketing events and digital campaigns directly with local field rep availability to boost conversion rates.

Why eSpatial?


We aren't just another complex mapping tool; we are your strategic partner in growth. Our platform is built for the business user, ensuring that your data stays secure and connected within your existing Salesforce environment. We focus on outcomes, like equitable workloads and quota attainment, rather than just "points on a map".

One of the biggest risks in adopting new technology is the "onboarding lag". We solve this with a human-first approach. Unlike other platforms that leave you with a chatbot, eSpatial provides real human experts to help you onboard. We help you get your project in action as quickly as possible with personalized training and setup assistance, all of which is fully inclusive. You get a dedicated partner committed to helping you turn location intelligence into revenue.

  • Quick Win: Use a shared visual language to align your marketing budget with actual revenue potential.
  • The Goal: Identify the "white space" for growth that traditional reporting tools intentionally hide.

Other Guides


You appear to be offline at the moment, this notice will disappear once your device can connect to the internet again