4.8/5 of 53 reviews
4.3/5 of 38 reviews

The Modern Sales
Team's Guide to
Winning with Maps


Eliminate territory blind spots, optimize field productivity, and drive data-backed growth across your entire organization.

2 people reviewing a pin map on a desktop computer screen

The Why Behind The Maps


For most marketing leaders, data isn't the problem, it's the delivery. You are likely drowning in rows of CRM data and Google Analytics. The challenge is the manual, disconnected process of trying to find geographic patterns in a spreadsheet. This "Excel Blind Spot" leads to superficial segmentation where you know who your customers are but not where they cluster. Without a visual layer, you're stuck with generic campaigns and "invisible ROI," where you can't definitively prove how marketing spend is impacting specific regions.

Mapping software uses location intelligence to deliver a shared visual language for all stakeholders. This allows you to move from guessing to knowing in real-time. The result: your team spends less time planning or driving and more time selling.

Who This Guide Is For:
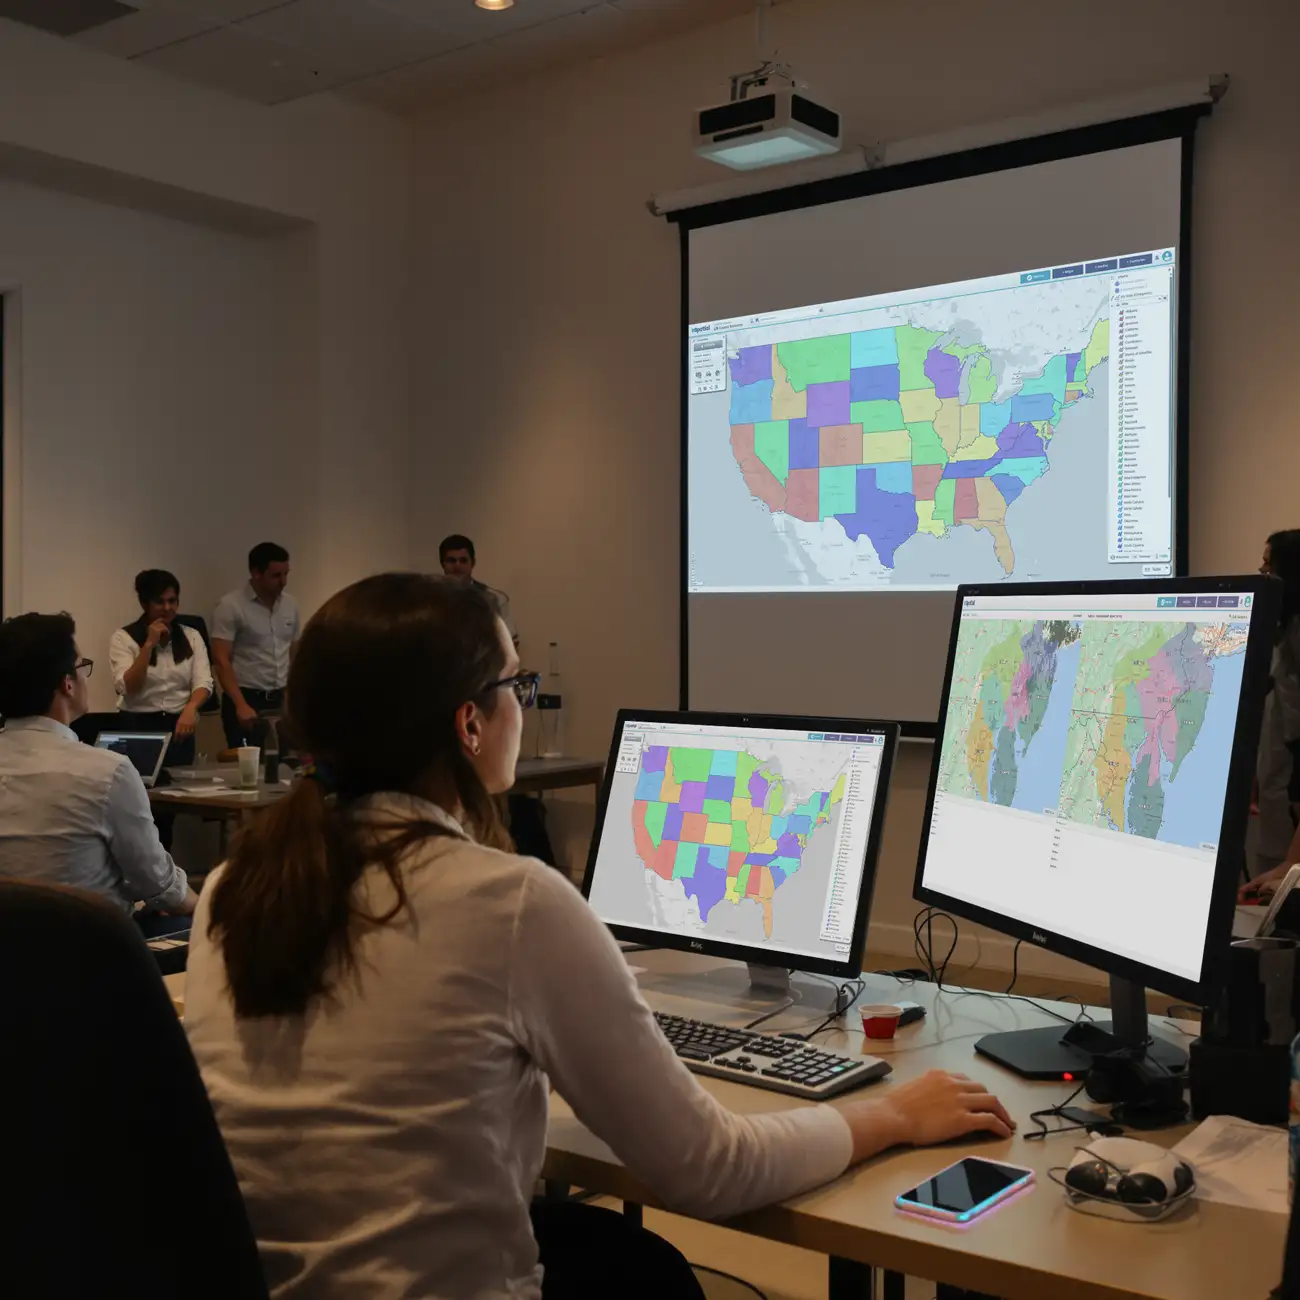
The Office-to-Field Ops Teams


Success happens when the plan made in the office matches the reality on the ground. This guide explains how different roles use specific map types to get on the same page.

Territory map on computer screen and projector

Sales Operations

For Sales Operations, the work begins with building a balanced foundation by mapping critical sales data. While the software removes the massive administrative burden of territory design, the goal isn't to replace human intuition, but to empower it. Instead of spending weeks manually balancing accounts in Excel, you use Account-Based and ZIP Code Maps to automate the heavy lifting. You can quickly model "what-if" scenarios—like adding a new rep or shifting a boundary, and see the impact instantly.

  • The Win: Automate the administrative burden of territory design while keeping the "human element" front and center.
  • Preferred Maps: Account-Based and ZIP/Post Code Territory Maps.
Team meeting reviewing radius map on projector

Sales Leaders & CROs

For Sales Leaders and CROs, mapping software provides a high-level view that acts as the "pulse" of the entire sales organization. It allows you to move beyond gut feelings by visualizing the "full pie", uncovering not just where you’ve historically sold, but where the true market potential remains untapped.

Maps make it easy to spot "hot" areas that need more resources and "blind spots" where you’re losing to competitors. This visual clarity provides the objective proof needed to justify budgets or headcount changes to the board or Finance.

  • The Win: Right resources, right place, right time, optimizing operations in hours, not weeks.
  • Preferred Maps: Territory Design & Optimization, Route planning and Resource allocation Maps.
Person reviewing spreadsheet on computer screen

Operations Managers

Operations Managers use mapping to manage field teams, facilities, and assets effectively. By moving away from slow, manual Excel processes that lead to logistical bottlenecks, you can make faster decisions on resource alignment. These maps allow you to balance competing department priorities (Sales vs. Service) and ensure that your team is deployed for maximum productivity and minimum travel time.

  • The Win: Right resources, right place, right time, optimizing operations in hours, not weeks.
  • Preferred Maps: Territory Design & Optimization, Route planning and Resource allocation Maps.

The 3-Stage Workflow to Strategic Alignment


Step 1

The Analysis Phase

Before you ever move a territory boundary, you need to understand the current landscape. This initial analysis is performed using a range of specialized tools. Hotspot Heatmaps and Regional Heatmaps instantly show you density, high-activity clusters and highlight performance by geographic boundaries.

To see specific account values, you can leverage Bubble Maps—where the size of the bubble represents the size of the opportunity—and Color-Coded Maps to categorize accounts (e.g., Tier A vs. Tier C) or competitor locations. This visual variety allows you to see the "why" behind your numbers before you begin the design phase.

  • The Win: Identify patterns and blind spots instantly by turning flat rows of data into visual insights.
  • The Logic: Start with a "visual audit" using a variety of heatmap and mapping styles to see where your customers, prospects, and competitors actually sit.
Step 2

The Design & Balancing Phase

Once you've uncovered your visual insights, you move into the territory tool to apply them. This is where Account-Based Territory Maps and Geographic Territory Maps become your most powerful assets.

Unlike basic tools, you can balance territories based on any metric. For example, you might design territories where 70% of the workload is for managing existing customers, leaving 30% for new account development.

By applying a sophisticated Workload Index algorithm, you ensure that every salesperson has the "just right" amount of opportunity, making their path to success mathematically possible and fair.

  • The Win: Create equitable territories where every salesperson has a genuine opportunity to hit their quota.
  • The Logic: Use Territory Design & Optimization Maps to balance territories based on the metrics that matter most—revenue and workload.
Step 3

The Collaboration & Buy-In Phase

Because territory changes can be sensitive, the final stage is all about transparency and iteration. eSpatial allows you to move beyond static reports and jump into live collaboration sessions via Zoom, Google Meet, or Microsoft Teams.

You can share different scenarios with your Managers and Sales Leaders, getting instant feedback on the "human" details, like a specific salesperson's deep relationship with a long-term account. By facilitating these real-time tweaks, you transform a potentially disruptive change into a shared strategic vision supported by the entire organization.

  • The Win: Secure immediate buy-in and minimize disruption by turning territory design into a collaborative, transparent process.
  • The Logic: Use live screen-sharing and scenario-sharing to capture ground-level intel—like historical customer relationships—that data alone can't see.

The eSpatial Difference: Real
Human Experts, Not Just Software


Software is only as powerful as its implementation. Unlike other platforms that leave you with a chatbot or a mountain of documentation, eSpatial provides real human experts to help you onboard. We help you get your project in action as quickly as possible with personalized training, project setup assistance, and ongoing support—all of which is fully inclusive. You get a dedicated partner committed to your project's success, manned by humans who understand your goals.

  • The Win: Get your project live and active in record time with dedicated onboarding and training.
  • The Value: Fully inclusive support with zero additional professional services charges.

Ready to see your "Full Potential"?

Other Guides


You appear to be offline at the moment, this notice will disappear once your device can connect to the internet again