
Overlaying your spreadsheet or CSV file on a map brings data to life. You will gain deeper insights and unlock powerful, interactive visualisations.
Our Customers Love Mapping With eSpatial
Map Your Data, Make Better Decisions

1. Pin Maps
Instantly plot critical locations. Pin maps give you a simple visual overview of customers, sales reps, offices, or other key assets.

2. Heat Maps
Instantly find your hot spots. Just like a weather map, heat maps reveal your highest and lowest performance areas.
They make complex information easy to communicate, blending stunning visuals with instant understanding.
Get Started With eSpatial Today
Our team is here to help you every step of the way

Start your free trial
No credit card required

3. Radius Maps
Analyze resources within a set distance. Radius maps are perfect for allocating resources and planning.
Example: A marketing manager can see how many customers are within a 20-mile radius of an event before booking the venue.
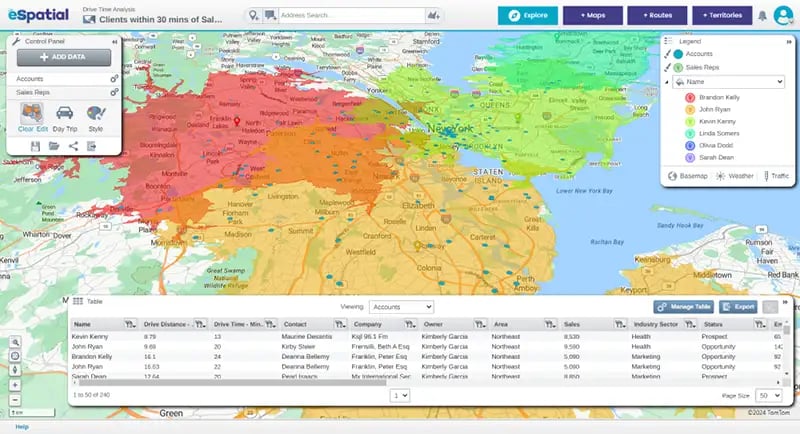
4. Drive-time Maps
See how far you can drive. While similar to radius maps, drivetime maps have one critical difference.
The radius is based on how far you can drive within a selected timeframe (e.g., 15 minutes), not just a fixed distance.
Trusted by Businesses All Across America
“We wanted to know for each of our plants. What is the plant's low-cost service area? What is the geographic region around that plant? And whether that plant is the most cost-effective option to ship concrete. We wanted to take advantage of that. We also wanted to know the most costly delivery areas in central Texas. And which of our customers are in those areas.”
Emily Jetmore
Business Analyst
“The first quick win for us was that eSpatial was so easy to use. After using so many other applications, eSpatial was the easiest for importing our data and identifying the fields and hierarchies that would deliver efficient alignments. At the end of the day, you are finalizing the sales territory in front of their eyes. It is much more real to the key stakeholders, which has been transformational for Thermo Fisher.”
Jamie Baker
Director of Sales Optimization
“Sales data can be mapped in minutes. That has saved us countless numbers of hours. And we have eliminated steps from the design and approvals process leading to faster more efficient alignments in less time. The findings in our eSpatial visualizations are definitely going to inform 2022 strategy for the better. 100%, we're going to renew our eSpatial license.”
Sarah Kirmani
Operations Manager
“We're always trying to improve our output and what we're putting in front of executive management teams and boards. We started looking around at different data visualization and mapping software programs and did a fair amount of due diligence on multiple companies. After vetting various platforms, eSpatial rose to the top of our list. I personally can say that we've loved it ever since.”
Andrew Rietz
Vice President
“I've been in this industry for 35 years, and to have a tool that I can pick up and use quickly just means the world to me. With eSpatial, I can create reports and make changes in 20 minutes, it's easy to log in and update things quickly. You wouldn't think in mapping software you would have someone so responsive in technical support. That was the prime reason I settled on eSpatial.”
Bruce Anderson
Director of Business Analytics and Strategy
“eSpatial has been an awesome tool for Starkey. From our territory planning; splitting territories, adjusting for local details, communicating and mocking up options. Then giving that updated detail to our sales team along with live access to CRM and trip planning. And then representing everything in a beautiful way that we love to use in presentations - it is truly a very impressive package.”
Alexandra Pike
Sales Operations
“eSpatial is an irreplaceable tool for our business, for example we are now able to run one of our key processes 32 times faster and have been able to double the number of customers we can visit in a given week by making better decisions. You can't control how much time you have in a given day, but you can control how it is used and eSpatial has certainly helped us significantly with that.”
James Cappiello
Director of Expansion