Our Customers Love Mapping With eSpatial
Step-by-Step: How to Create Your First Map
Follow these simple steps and create a map in minutes
Step 1
Sign Up
Sign up with your name, email, and a password; no credit card required. In seconds, you’ll see the dashboard.
Create your first map
in minutes
eSpatial requires JavaScript to run. Please enable JavaScript to sign up for a free trial
Once you sign up you will receive an email from no_reply@espatial.com with a link to activate your trial
Step 2
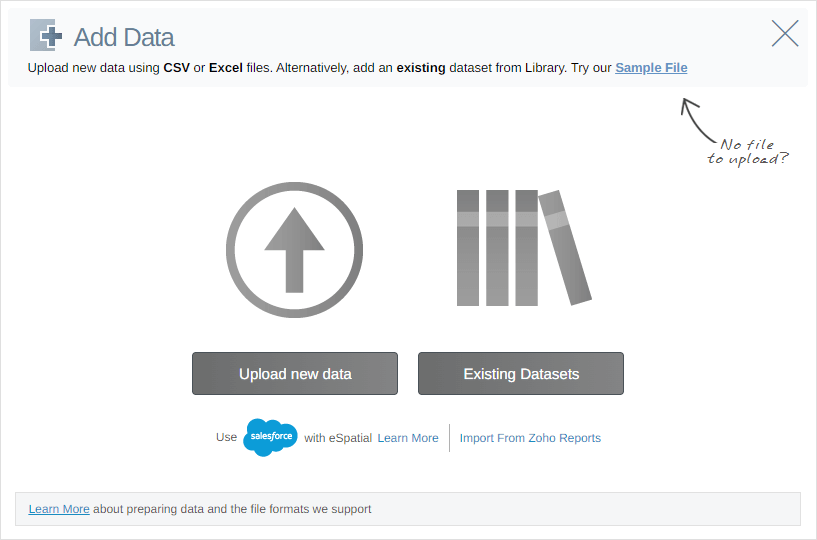
Upload Your Data
- Save your Excel data as an (xls or xlsx) or CSV file
- Click the Add Data button
- Your file should include a location field (like addresses, ZIP/Postcodes, or coordinates)
Step 3
Choose Your Map Type
eSpatial offers several powerful map types to visualize data:
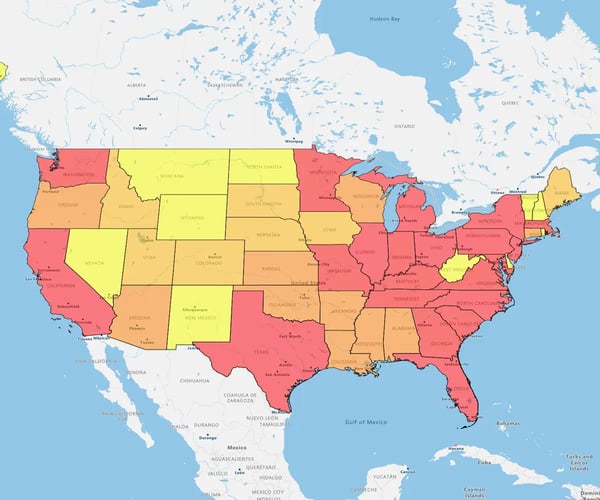
- Pin Maps: Plot and view data for quick visual analysis
- Regional Heat Maps: Color geographic regions to reveal intensity levels in your data.
- Heat Maps: Spot data density trends, like sales or customer concentration
- Territory Maps: Design, balance, and manage territories
- Route Maps: Plan and optimize travel routes
- Bubble Maps: Compare data values visually using proportional circles
- Nearest Neighbor Maps: Find closest reps, leads, or locations with precision
A Pin Map is a great entry point and easy to build from as your needs grow.

If you're a first-time user, just follow the step-by-step instructions. Seeing your data on an eSpatial map for the first time is awesome!
Step 4
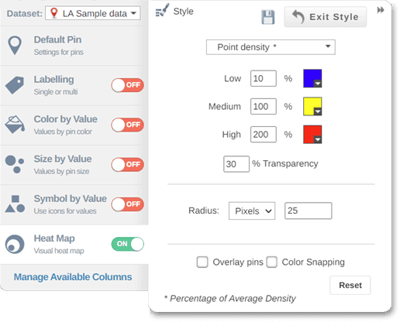
Style and Customize Your Map
Bring your map to life with customization and styling options .
- Choose colors, gradients, and map themes to highlight trends
- Adjust pin styles, such as size, shape, and color
- Use labels and tooltips to show important details
- Use drawing features like the polygon and lasso to fine-tune your territories
- Toggle map backgrounds (road, satellite, dark mode, etc.)
Step 5
Explore & Analyse
Use eSpatial’s interactive tools to:
- Click on pins or regions to see detailed information about each location
- Filter your data to focus on specific regions, reps, or customer types
- Drill down into layers for deeper insights, like comparing sales by region or identifying service gaps
- Create map charts to give viewers an alternative visual summary of the data alongside the map

Step 6
Save, Share, or Export
Once you’re happy:
- Save it to your eSpatial account
- Share it publicly or privately
- Export it as a PDF, image, or presentation.

Trusted by Businesses All Across America
“We wanted to know for each of our plants. What is the plant's low-cost service area? What is the geographic region around that plant? And whether that plant is the most cost-effective option to ship concrete. We wanted to take advantage of that. We also wanted to know the most costly delivery areas in central Texas. And which of our customers are in those areas.”
“The first quick win for us was that eSpatial was so easy to use. After using so many other applications, eSpatial was the easiest for importing our data and identifying the fields and hierarchies that would deliver efficient alignments. At the end of the day, you are finalizing the sales territory in front of their eyes. It is much more real to the key stakeholders, which has been transformational for Thermo Fisher.”
“Sales data can be mapped in minutes. That has saved us countless numbers of hours. And we have eliminated steps from the design and approvals process leading to faster more efficient alignments in less time. The findings in our eSpatial visualizations are definitely going to inform 2022 strategy for the better. 100%, we're going to renew our eSpatial license.”
“We're always trying to improve our output and what we're putting in front of executive management teams and boards. We started looking around at different data visualization and mapping software programs and did a fair amount of due diligence on multiple companies. After vetting various platforms, eSpatial rose to the top of our list. I personally can say that we've loved it ever since.”
“I've been in this industry for 35 years, and to have a tool that I can pick up and use quickly just means the world to me. With eSpatial, I can create reports and make changes in 20 minutes, it's easy to log in and update things quickly. You wouldn't think in mapping software you would have someone so responsive in technical support. That was the prime reason I settled on eSpatial.”
“eSpatial has been an awesome tool for Starkey. From our territory planning; splitting territories, adjusting for local details, communicating and mocking up options. Then giving that updated detail to our sales team along with live access to CRM and trip planning. And then representing everything in a beautiful way that we love to use in presentations - it is truly a very impressive package.”
“eSpatial is an irreplaceable tool for our business, for example we are now able to run one of our key processes 32 times faster and have been able to double the number of customers we can visit in a given week by making better decisions. You can't control how much time you have in a given day, but you can control how it is used and eSpatial has certainly helped us significantly with that.”