|
The CRM Struggle |
The eSpatial Advantage |
|---|---|
|
Cognitive Overload: Reps spend hours doing mental math, trying to figure out which accounts in their 500-person list are close enough to visit on Tuesday. |
Visual Clustering: Reps look at a map, instantly see 4 high-value accounts clustered together, and intuitively book their meetings in minutes. |
|
Invisible Pipeline: "We have $5M in the pipeline, but I have no idea if it's concentrated in the Northeast or spread out across three states". |
Visual Sales Pipeline: A single glance at your sales mapping software shows exactly where your open deals are geographically bottlenecked. |
|
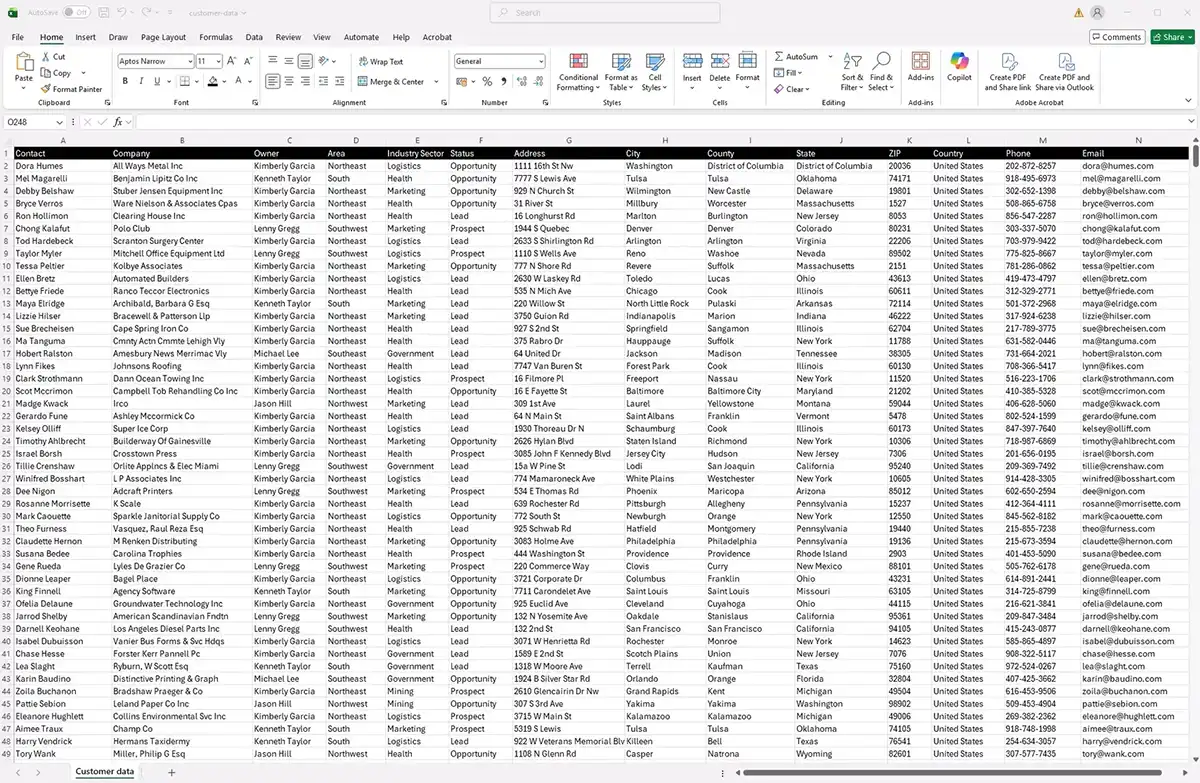
Siloed Sales Data Analysis: Exporting Salesforce data into Excel pivot tables just to figure out regional quota attainment. |
Integrated Account Mapping: Natively map and analyze your CRM data inside Salesforce to identify regional gaps instantly. |
Empowering Sales Ops & Field
Reps for Peak Performance

1. Account Mapping & Visual Sales Pipeline
Scrolling through CRM list views hides the geographic reality of your deals. eSpatial's sales mapping software translates dense text into a visual sales pipeline. By pinning your accounts onto a map, sales leaders and Sales Ops can instantly perform sales pipeline analysis to see:
- Where deals are progressing
- Where they are stalled
- Where the highest-value accounts are concentrated
This account mapping approach bridges the gap between raw data and actual field strategy, allowing your team to close geographic gaps in the market before competitors do.

2. ZIP Code Mapping for Sales Data Analysis
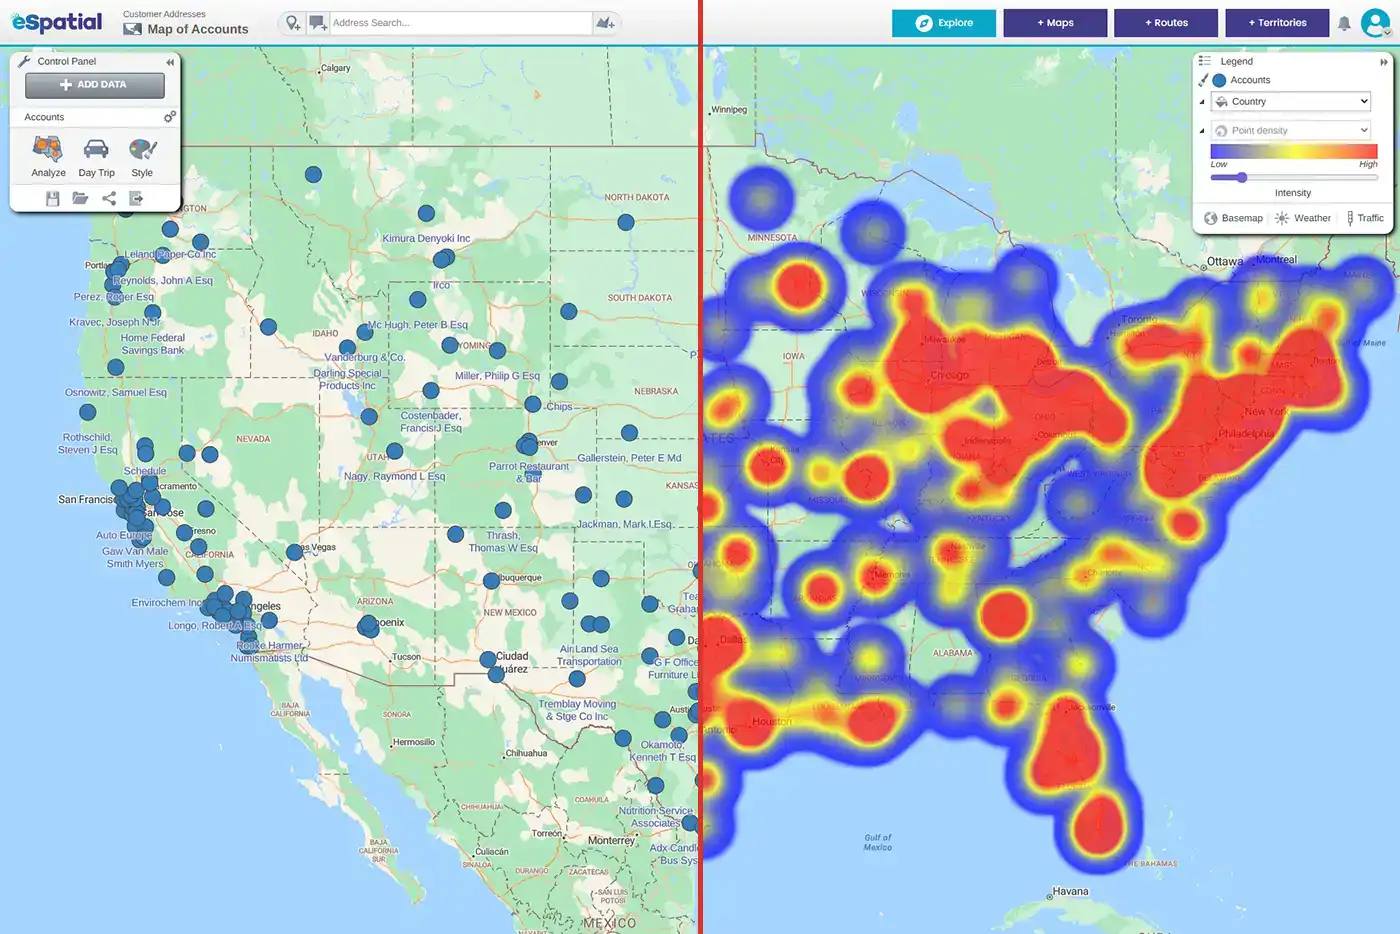
National numbers mean nothing if regional territories are failing. eSpatial allows Sales Ops teams to aggregate complex sales data analysis by ZIP codes or postal boundaries. This grouping gives sales leaders a clear, color-coded picture of regional health and quota attainment.
Generate a sales heat map to:
- Identify if a specific postal code is carrying the entire state's quota
- See if a neighboring ZIP code requires immediate pipeline generation efforts

3. Reducing Cognitive Load for Field Reps
Field reps are hired to sell, not to be logistics experts doing geographic mental math. Without sales data visualization, reps waste up to 5 hours a week trying to cross-reference spreadsheets with mapping apps to plan their week.
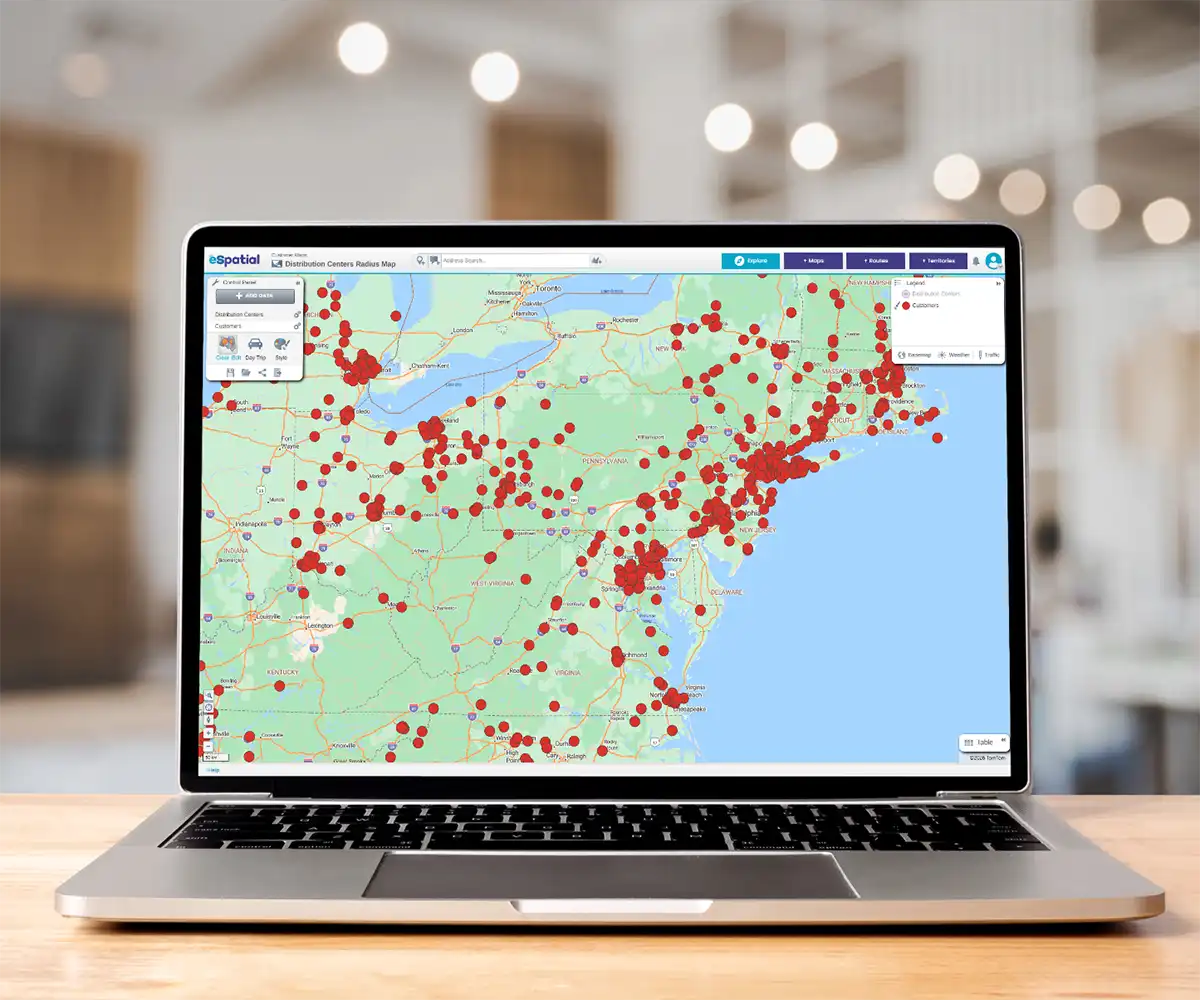
By putting an intuitive sales mapping tool in their hands, reps can view their accounts as geographic clusters. A quick glance immediately shows them where to focus their travel, making their trips highly profitable and giving them back hours of selling time.
Industry Spotlight: Driving
Pipeline & Field Efficiency

Stop guessing where your next clinic belongs. Most healthcare leaders rely on spreadsheets that hide the truth about patient access . eSpatial turns that data into a clear story, allowing you to validate that 70% of employees are within a 10-mile radius of your care.
Whether you are identifying service gaps or presenting a winning Request for Proposal (RFP), we give you the visual proof needed to expand with confidence and close more business.

Take the driver's seat in your sales process. Relying on distributors to bring you leads is a passive way to grow. Innovative manufacturers use eSpatial to gain full visibility over end customers, allowing sales reps to spend 30% more time selling and 67% less time onboarding. By mapping your install base and identifying underserved territories, you can ensure your technicians and sales reps are positioned exactly where the revenue is.

Unlock your next $1,000,000 in growth. When your safety or specialist teams double in size, legacy alignment tools just cannot keep up. Our clients use eSpatial to finalize sales territories right in front of stakeholders, cutting project delivery times from a year down to just four months.
This clarity allows you to unlock an additional 10% in sales potential and ensure your high-value reps are not wasting their day behind a windshield.

Reclaim your shelf space from the road. Managing over 17,000 retail locations shouldn't feel like a guessing game. Leading distributors and retail managers use eSpatial to move from broad ZIP code areas to precise account-based territories, ensuring merchandising and reset teams are matched to store workloads based on actual rep availability.
By cutting down on unnecessary "windshield time," your reps spend more time in-store where the revenue is generated—helping you lower service costs and improve the shopping experience across your entire national footprint.

Master the complexity of thousands of locations without breaking a sweat. Managing a national distribution network requires more than just a basic map—it requires account-based precision.
World leading distributors use eSpatial to balance workloads for thousands of reps, ensuring full-time staff are optimized and service costs are lowered. From cutting route creation time in half to identifying high-priority leads near existing stops, we help you maintain perfect data hygiene while doubling your team's productivity.

Optimize your workforce while the competition is still calculating. Managing 1,000+ sales reps across the country is a logistical nightmare without a visual guide. eSpatial helps staffing leaders strategically place talent and identify new office locations based on real market demand.
By optimizing your office assignments and reducing travel time, you stop wasting fuel and start driving the operational efficiency that leads to increased revenue.
Mapping Software Solutions
-
 Reporting & Visualization
Tell a data story the boardroom understands. Generate presentation-ready, color-coded, and radius maps from your data instantly.
-
 Market Analysis & Trends
Find your white space. Use heat maps and spatial analysis to spot regional gaps, untapped potential, and de-risk expansion.
-
 Strategic Location Decisions
Align physical assets with demand. Map workforce locations securely, optimize site selection, and mitigate risk with proximity analysis.