Quick answer
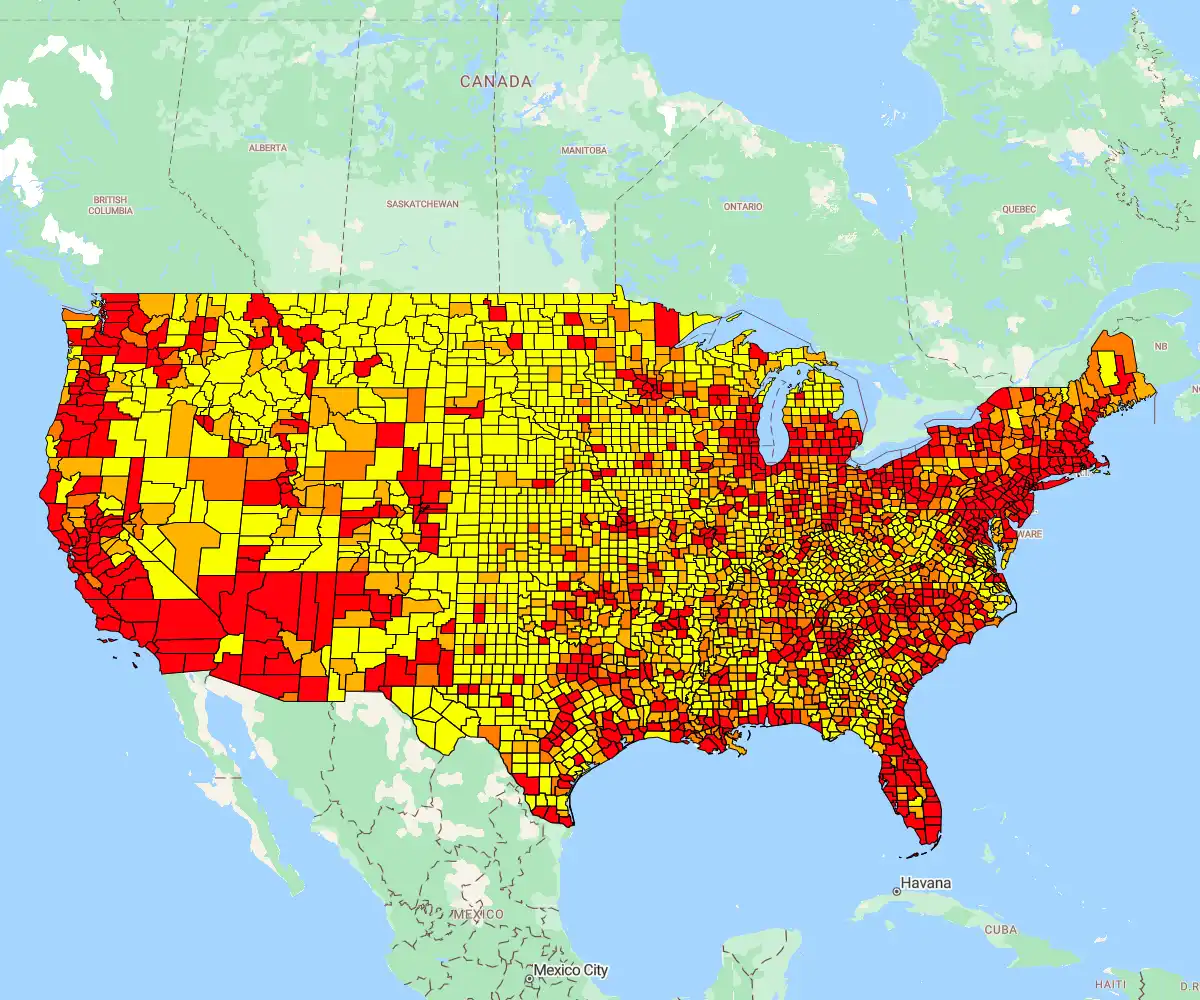
Heat maps are a powerful data visualization tool that transform complex data into clear, actionable insights by using color gradients on a geographic map to show data concentration.
Key takeaways:
- Visualize hidden patterns: Turn spreadsheets into maps to easily spot customer clusters, trends, and growth opportunities
- Optimize resource allocation: Identify gaps in market coverage and refine distribution networks for better efficiency
- Target campaigns: Pinpoint areas of high audience density to maximize the impact of marketing efforts
- Make faster decisions: Use geospatial data to support quicker, more informed business decisions and strategic planning
Heat maps are powerful data visualization tools that help businesses turn complex data into clear, actionable insights. At a glance, they show where things are working, and where attention is needed.
Here are five key ways organizations use heat maps:
- Spot customer clusters and high-performing regions with geospatial business mapping
- Optimize sales and service coverage by visualizing gaps and overlaps in resource allocation
- Target marketing campaigns based on audience density and regional trends
- Reveal market opportunities by tracking shifting demand and performance over time
- Support faster, smarter decisions with clear visuals that surface key patterns instantly
What is a Heat Map in Business?
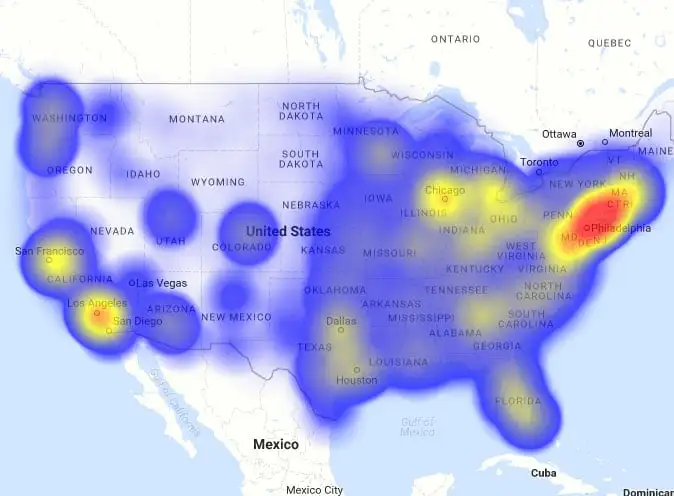
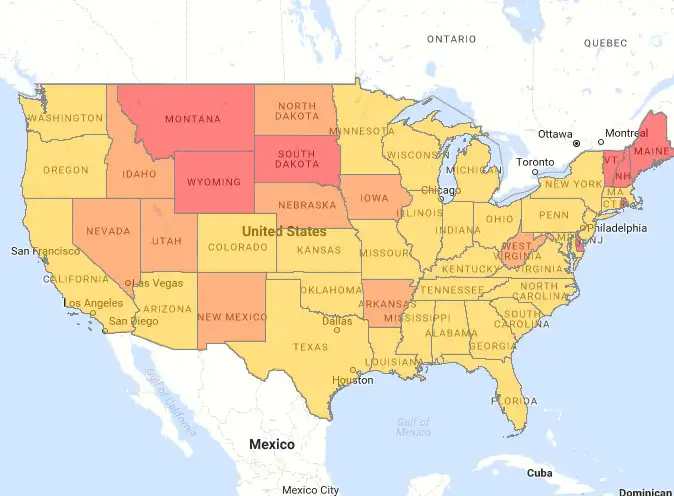
A heat map is a data visualization tool that uses color gradients to represent the concentration or intensity of data values within a specific area. They are typically used on geographic maps to highlight business-related patterns and trends. It can also reveal outliers that might otherwise go unnoticed in spreadsheets or charts.
Take these use cases for example: A sales manager might use a heat map to quickly see where their top-performing regions are based on revenue. Or, a logistics team might identify delivery bottlenecks by mapping customer service calls.
Heat maps are valuable because they:
- Make complex data instantly understandable at a glance.
- Help identify opportunities for growth or areas of concern.
- Improve decision-making by revealing spatial relationships in your data.
These visual tools are widely used across industries. From answering sales questions using heat maps to planning new marketing campaigns or improving operations and logistics, using mapping software for business efficiency is a no-brainer.
What is a Heat Map Used For?
Heat maps turn complex location data into clear, practical insights across business functions. They help identify customer clusters, optimize resources, and effectively target marketing campaigns. By revealing key patterns in customer behavior, sales performance, and market opportunities, heat maps empower smarter, faster decision-making.
Geospatial Business Mapping
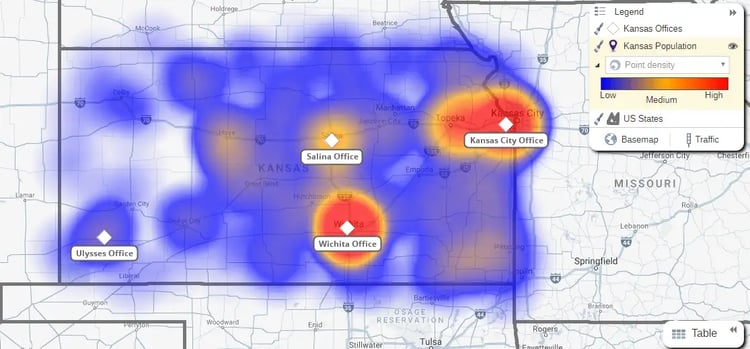
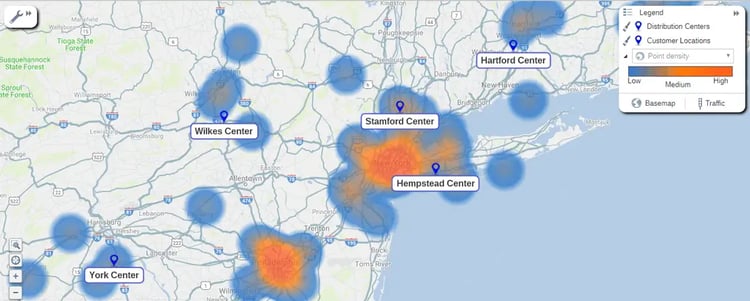
One common use is identifying customer clusters, competitors, or store locations using hotspot heat maps. These visualizations enable rapid insights into where your business is performing well, where your customers are coming from, and where potential market opportunities may exist.
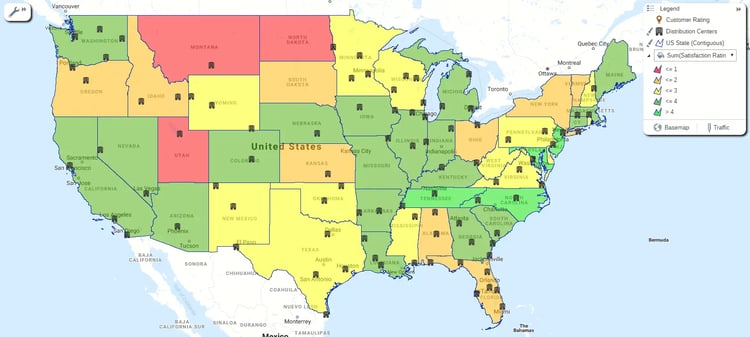
Heat maps are also effective for analyzing regional trends. Businesses often use them to assess performance metrics like customer satisfaction, sales volume, or service coverage. This geospatial analysis guides strategic planning, such as where to expand operations or reallocate resources based on performance by region.
Performance and Resource Optimization
Heat maps are essential tools for optimizing performance and resource allocation. By overlaying sales data, customer locations, and competitor footprints, organizations can quickly spot gaps in market coverage that signal untapped opportunities. This helps business owners identify areas for expansion.
Heat maps can help refine your distribution networks and guide hiring decisions. When you can see customer locations in relation to your distribution centers, you can make informed decisions on the sites that will provide maximum customer service levels with minimum cost. You can also optimize the volume of customers in a region and balance the workload for your teams.

Campaign targeting and market opportunities
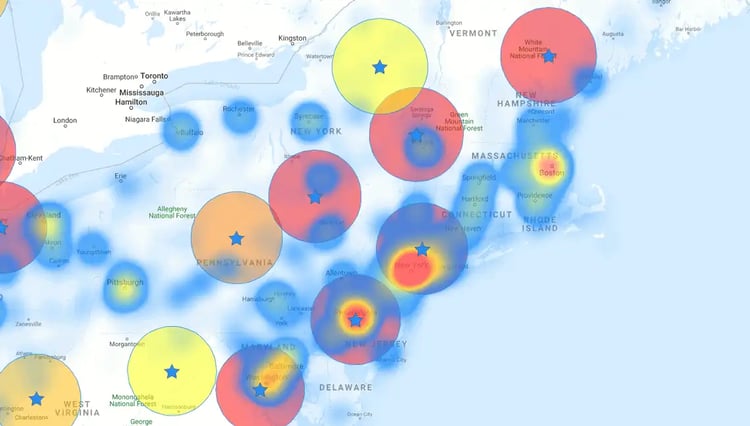
Heat maps help businesses sharpen their marketing and outreach efforts. By layering in third-party or customer data, marketers can pinpoint geographic pockets where their ideal audience is concentrated. This enables smarter campaign planning that aligns with actual market demand.
For example, a fashion retail store in Texas is planning to run a billboard campaign. Using a regional heat map of demographic data, they see the optimal locations for billboards based on the population densities of their target audience (females aged 22 to 29). Armed with intelligent maps, they quickly select the best spots to maximize campaign impact.
Organizations also use heat maps to spot emerging market opportunities and shifts in consumer behavior. Mapping trends over time reveals patterns hidden in static data. This helps businesses act early
Why Organizations Use Heat Maps
So, what is a heat map used for in data visualization? Heat maps aren’t just visually appealing; they drive tangible business results across teams. They simplify complex location data and help decision-makers act faster and smarter.
- Accelerated decision-making: By surfacing key trends through hot‑spot and regional maps, teams can understand data intuitively and respond quickly.
- Focused growth & campaign targeting: Identifying customer clusters and high-potential regions empowers strategic marketing, distribution center placement, and sales territory optimization.
- Operational efficiency & cost savings: Mapping customer density and service routes enables optimization of resource allocation, balancing workloads, reducing drive time, and cutting expenses.
How to Create and Use a Heat Map
It's easy to create a heat map for business analysis in eSpatial. Start by setting up a free trial account. When you’re ready, follow these steps:
Gather numeric data
You first have to collect relevant data for your map. It will form the basis for all of your analysis and be displayed as points on your map. This could be sales data, service data, demographic information, and other KPIs.
Select heat map type
These are the two main types of heat maps:
- Hot spot heat maps show data density using color intensity, making it easy to identify clusters of activity, such as customer concentrations or sales hotspots.
- Regional heat maps aggregate data by geographic boundaries (e.g., ZIP codes, states), helping compare performance across defined areas like sales territories or service regions.
Choose appropriate colors and legend
The colors you choose for your heat map are crucial as they help make the data legible. There are a few key aspects to consider:
- Choose intuitive color gradients:Use a sequential spectrum (cool to warm) to represent data intensity. For example, blues represent low values and reds represent high values. Adjusting transparency helps the underlying geography remain visible.
- Custom thresholds and clarity: Define meaningful value ranges (e.g., low, medium, high). Assign distinct colors to each. This structure helps users quickly locate regions worth paying attention to.
- Use a clear, labeled legend: Include a legend that links colors to specific data ranges. Color on its own has no inherent association with value, so a key is vital for users to understand the values in a heatmap.
eSpatial’s advanced mapping software simplifies this entire process with smart defaults and flexible customization, ensuring your heat maps are not only visually clear but also immediately actionable.
Overlay data using tools
Our mapping tool lets you easily overlay your own data, such as customer locations, sales figures, competitor sites, or demographic statistics, onto a number of pre-made boundary and demographic datasets. This step lets you visualize relationships, trends, and gaps. For example, you might discover underserved high-potential regions by overlaying sales performance with population density.
Interpret and iterate
Analyze the patterns your heat map reveals and use those insights to take informed action. Remember, heat mapping is not a one-time task; business data changes, and so should your maps. Refining your approach as new data becomes available helps to ensure your decisions stay accurate, relevant, and aligned with evolving goals.
Conclusion
So there you have it, brilliant ways organizations use heat maps that you might not have thought of. It goes to show that the answer to “what is a heat map used for?” goes far beyond the basics. For eSpatial pricing and plans info, view our plan comparison or schedule a call with our team.


