• Data visualization

Build a Powerful Proximity Map in 5 Steps

Liam Costello
  • Published: February 15, 2024
  • Updated: November 21, 2025
  • Author: Liam Costello
  • Reading time: 10 mins

Quick answer

A proximity map (or buffer map) uses circles to visualize the distance or drive time around a central point. It turns spatial relationships into strategic clarity, helping businesses identify exactly where they win and where they are missing out.

The impact

  • Identify hotspots: Spots customer clusters instantly for hyper-targeted marketing
  • Find gaps: Exposes coverage voids to guide expansion and site selection
  • Reduce risk: Models "what-if" scenarios to predict outcomes before committing resources
  • Analyze competition: Visualizes exactly how close competitors are to your key assets

Location drives strategy. Knowing exactly where your customers and competitors sit is the difference between guessing and growing.

  • Enter the proximity map: A tool that visualizes the landscape around key locations to highlight spatial relationships.
  • Why it matters: You move beyond spreadsheets to see the real world. Proximity data helps you:
    • Spot customer hot spots
    • Fill coverage gaps
    • Optimize logistics

In this guide, we will cover the essentials, what they are, why you need them, and how to build one fast.
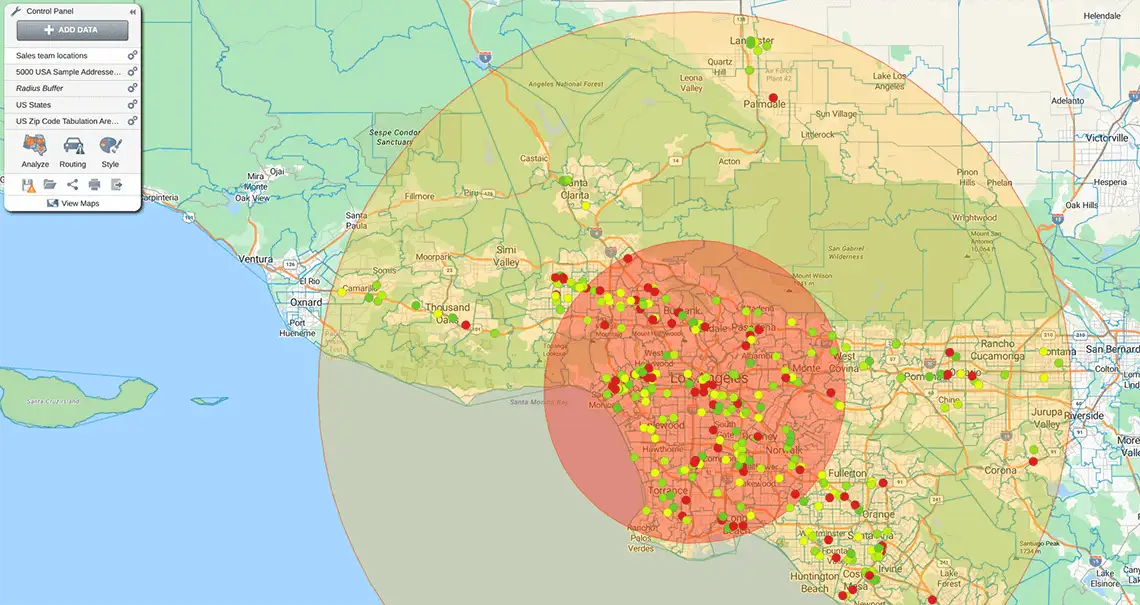
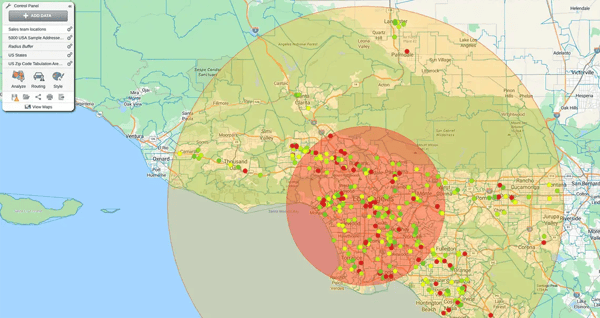
Proximity map with separate 25 and 50 mile radiuses

25-mile radius

50-mile radius

What is a Proximity Map?


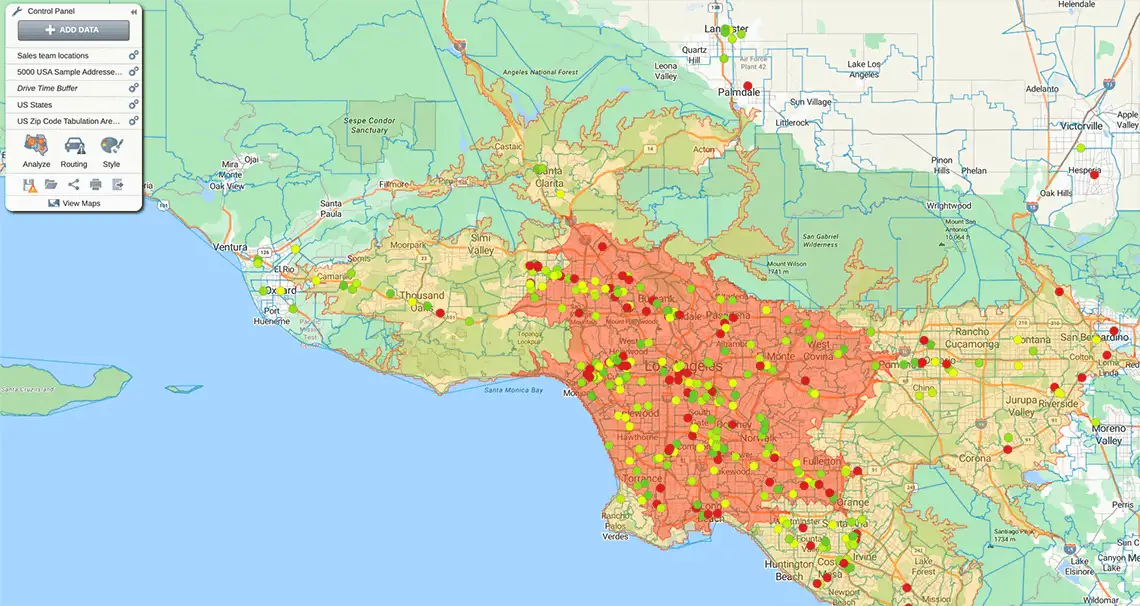
A proximity map (or radius map) visualizes the area surrounding a central point using concentric circles. Spreadsheets hide context. Proximity maps reveal it.

Instead of placing "mental pins" on a list, you dynamically map locations to see spatial relationships instantly. By overlaying distance zones, you can visually analyze the density, distribution, and proximity of customers or assets around your key sites.

The impact: Whether it’s 5 miles or 500, you see exactly what is happening within your specific boundary.

What Are Proximity Maps Used For?


If you ask "where," you need a proximity map. From supply chains to site selection, mapping spatial relationships reveals opportunities to optimize.
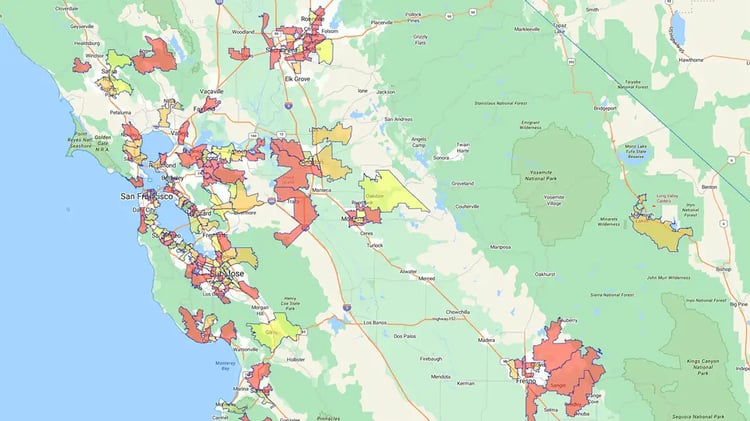
1. Analyze markets

Go beyond the zip code. Proximity maps reveal buyer density, demographic trends, and coverage gaps down to the neighborhood level.

  • You stop guessing where the demand is
  • Spot untapped pockets of potential customers instantly
  • Tailor outreach based on hyper-local data and monitor competitor impact in real time
Regional heatmap in San Francisco

2. Select optimal sites

Opening a new location requires balancing opportunity with competition. Proximity maps visualize trade areas to reveal exactly where demand exceeds supply.

Reduce the risk: Use "what if" scenarios to model overlapping coverage before you sign a lease.

  • Project sales accurately
  • Prevent cannibalizing your own existing stores
Proximity nearest neighbor map

3. Target smarter

Sharpen local marketing. A proximity map of loyalty members highlights exactly which neighborhoods are engaged—and which have untapped potential. You can hyper-target campaigns to acquire similar consumers within a specific radius.

Use the data to drive efficient:

  • Direct mail
  • Local events
  • Neighborhood-exclusive deals
Proximity map drive time buffer

30-minute drivetime

60-minute drivetime

4. Streamline logistics

Find the fastest path. Logistics relies on mapping the exact relationship between suppliers, facilities, and customers. Proximity analysis determines the closest, least costly routing options instantly.

Planners use this visual intelligence to compare drive times and costs to optimize:

  • Freight movement
  • Fleet operations
  • Yard management

5. Track competitors

Map the battlefield. Accurate benchmarking depends on visualizing your rival's sphere of influence against your own. You stop flying blind. By overlaying competitor data, you reveal:

  • Prime locations for new units (offense)
  • At-risk areas for market share loss (defense)
  • Real brand penetration across specific locales

How to Build a Proximity Map


Creating a proximity map with tools like eSpatial is fast. Follow this guide to turn raw data into spatial insight.

1. Define the goal

Don't map without a mission. Frame the specific business question first—whether it's exploring new markets, analyzing a store closure, or benchmarking competitors.

2. Choose a mapping software

You need a cloud-based solution. Look for software that centralizes data management and offers proximity control, the ability to set precise drive times, radii, and data filters from anywhere.

3. Plot the radius

Select your central points (stores, hubs) and apply the radius tool to map buffer zones.

  • Adjust scale: Range from 1 mile to 150+ miles
  • Factor drive time: Account for road infrastructure, not just straight-line distance
  • Model overlaps: See where coverage zones intersect

4. Set the rules

Align parameters with your specific use case (e.g., a 10-mile trade area for retail).

Define buffer distances, datasets (customer density, income), and visual settings (color-coding) to ensure you map the right variables.
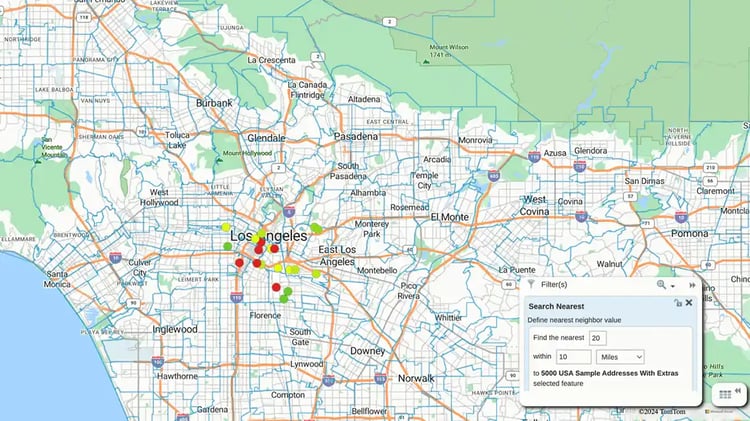
5. Analyze And Act

The map turns data into intelligence. Now, interpret it to drive decisions.

  • Hot spot analysis: Identify high-density clusters
  • Threshold analysis: Isolate areas meeting specific income or population criteria
  • "What-if" scenarios: Project the impact of new sites on existing ones before you build

Mapping Solutions For
Businesses From eSpatial


Location data is the key to outmaneuvering rivals. Proximity mapping reveals hidden relationships and trends, turning disparate data into a clear strategy.

eSpatial's powerful mapping software makes it easy

  • No coding required: You don't need GIS skills to generate complex radial analysis
  • Visualize instantly: Integrate proprietary and public datasets to see the full picture

Maximize the power of proximity mapping with eSpatial, an intuitive territory management software. Get started with a 14-day free trial today to experience the game-changing power of proximity maps!

Frequently Asked Questions


How Do I Find Nearby Customers Without the Spreadsheet Hours?

A proximity map plots your CRM data in real-time, eliminating static, error-prone spreadsheets.

The fix: Draw a radius around any location to see every customer or lead instantly.

You move from guesswork to action in seconds:

  • Plan efficiently: Build multi-stop field trips with zero friction
  • Target instantly: Identify all accounts within a 10-mile radius
  • Stay current: Decisions are based on live data, not last week's export

How Do I Pick the Perfect Event Location?

Find your "center of gravity". Don't stare at a spreadsheet; map your high-value customers to reveal exactly where they cluster. Visually identify the geographic center of your key accounts to select a venue that ensures maximum convenience.

  • Boost attendance: Guests show up when the drive is short
  • Spend wisely: Target your event budget exactly where your VIPs live

How Do I Fairly Reassign Accounts Without the Chaos?

Don't rely on gut feelings. A proximity map plots vacant accounts against your existing team to reveal exactly who is closest.

The fix: Reassign territories based on location, not guesswork.

Why it matters: Data-driven transitions prevent burnout and service gaps.

  • Ensure equity: Distribute workload fairly based on geography
  • Slash travel: Minimize drive time for the new account owners
  • Maintain continuity: Keep customers happy during the handoff

How Do I Target Local Ads Without Guessing?

Proximity mapping identifies exactly where your most profitable customers live and work. Stop wasting spend on dead zones. Instead, plot existing customer data to uncover hotspots of opportunity.

You replace "spray and pray" with precision.

  • Define boundaries: Use radius analysis to set exact campaign limits
  • Maximize ROI: Ensure every dollar reaches someone likely to buy

How Do I Expand Without Cannibalizing Sales?

Map your gaps. Don't guess where to open next. Proximity analysis reveals exactly where your current trade areas end and new opportunities begin. Visualize drive-time zones around existing stores to instantly spot:

  • Underserved pockets: Safe locations for fresh market share
  • Overlap risks: Danger zones that will hurt existing revenue

The result: You grow the franchise without stealing from yourself.

Is This Too Complex for My Reps?

Three clicks to insight. eSpatial is designed for speed, not IT pros. We integrate directly into the tools they already use (CRM, Excel), so there is zero learning curve.

Why it works

  • Stay put: Reps create maps without ever leaving their familiar workflow
  • Get answers: They find the nearest accounts instantly
  • Sell more: They spend time closing deals, not fighting software

How Do I Prove ROI to My Sales Vp?

It's not about aesthetics. It's about efficiency and revenue.

The Business Case: Proximity mapping directly drives quota attainment.

  • Slash expenses: Optimizing daily routes cuts travel time by 20%, significantly reducing fuel costs
  • Boost activity: Less time driving means more customer meetings per week
  • Retain talent: Balanced territories prevent burnout and costly rep turnover

How Do I Prove Marketing ROI to My Director?

Eliminate wasted spend. Show your director that proximity analysis lowers acquisition costs by targeting only high-potential areas.

The Business Case

  • Don't blast everyone. Use proximity to identify and target the top 10% of relevant ZIP codes
  • You yield higher response rates and more qualified leads for a fraction of the cost

The bottom line: It’s not a tech expense; it's a precision lead-generation tool.

You appear to be offline at the moment, this notice will disappear once your device can connect to the internet again