
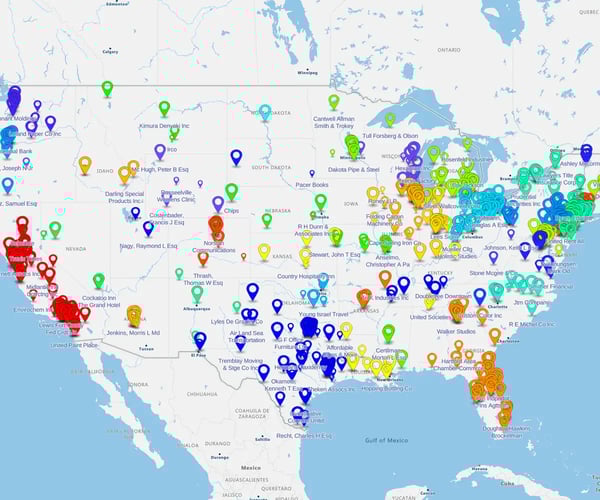
Mapping by pin size is a visualization technique that represents data values using varying pin sizes on a map. One of the top benefits of using sales mapping software to create maps with pins is visualizing customer or sales data by location. This makes it easy to spot patterns, trends, and gaps. They're often used in sales and field operations, retail and franchise, logistics and transportation, real estate, and utilities industries.
Why use variable pin sizes on maps?
eSpatial's business data mapping software allows you to reveal data value by pin size – the bigger the value, the bigger the pin size on the map. Creating a map by pin size makes it easy to spot trends, outliers, and priority areas. Below is an example of using different-sized pins to reveal volumes.
Bring your data to life by sizing pins according to value in a few simple steps using our flexible mapping software. Upload or open your dataset, head over to the Style & Color panel, choose the Style by Value tab, pick your numeric field, set your sizing scale, and save.
Step 1
Upload or Import Your Data
Either upload your data to eSpatial in the normal way or open up an existing dataset contained in the eSpatial maps and datasets library. (TIP: If you're just testing out eSpatial, just sign up for a free trial below and use our sample data).
Create your first map
in minutes
eSpatial requires JavaScript to run. Please enable JavaScript to sign up for a free trial
Once you sign up you will receive an email from no_reply@espatial.com with a link to activate your trial
Step 2
Enable Style by Value
In the Control Panel, click Style & Color of the dataset you want to map by pin size.
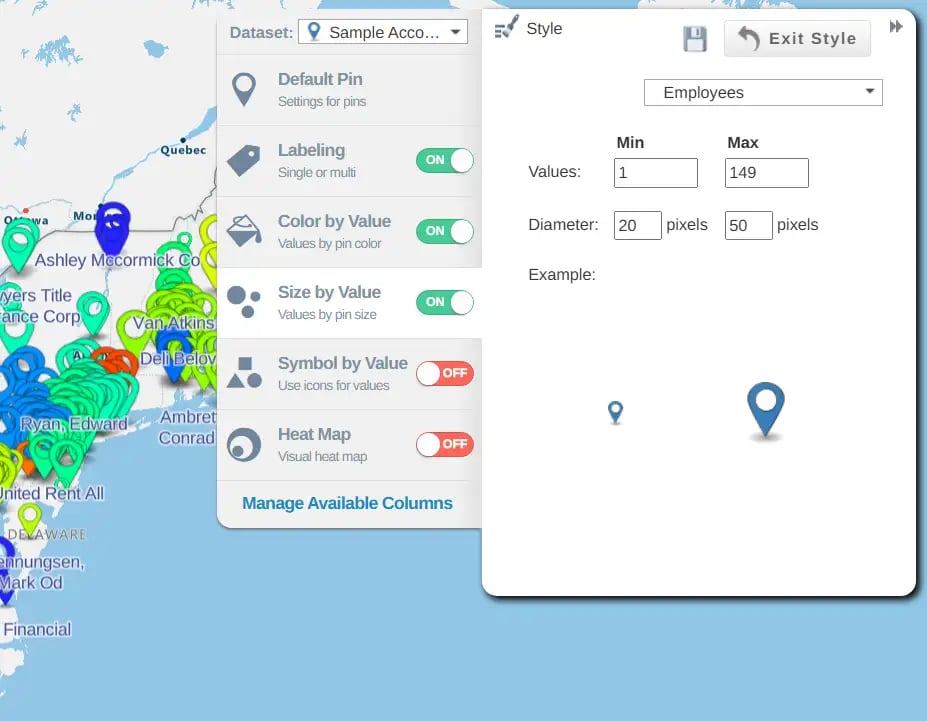
Select the Size by Value tab in the Style panel on the right of the screen and input the values that will apply when you map quantities by pin size.
Step 3
Set Pin Size Based on Values
You can choose which metric drives your map pin sizes.
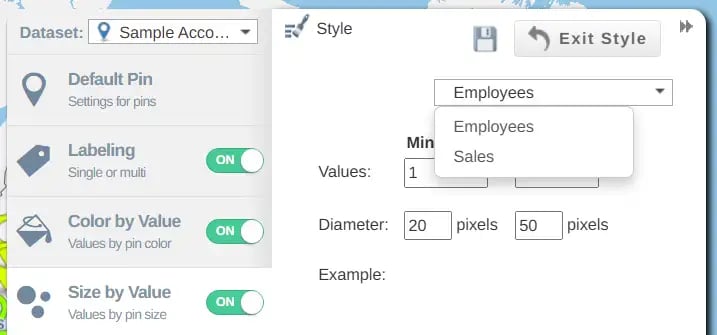
In the Style by Value settings, choose the numeric column (e.g., "Total Sales" or "Customer Count") on which you want to base the pin size. eSpatial will automatically scale the pins proportionally according to your inputs, creating visual emphasis where values are highest.
You can adjust the data value range as well as the diameter of your smallest to largest pins.
When you are happy with how the data appears on the map, when sized by quantity, click the save icon and close the Style and Color panel.
Step 4
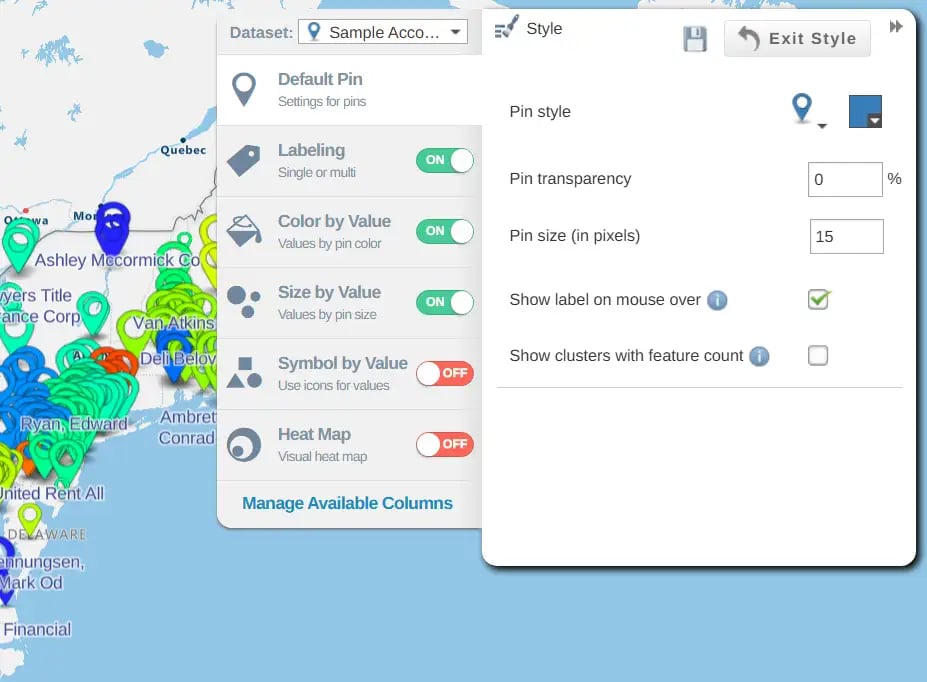
Customize Pin Appearance and Labels
When you create a map with eSpatial you can edit the appearance of map pins anytime by going into the Style & Color menu and clicking the Style tab. For instance, in the map below, I have changed the icon style and the color. I have also turned on the labeling feature.
Let's say you want to visualize total sales by location. You upload a spreadsheet with columns for City, State, and Total Sales. Once imported, you can access the Style & Color panel and select the Style by Value tab, then choose the Total Sales column as the value (i.e. the data you want to be mapped by size).
You can then customize the pin sizes to control the minimum and maximum dimensions, making the visual differences clearer or more subtle. Additionally, you can adjust the pin values to focus on specific ranges or thresholds that matter most to your analysis.