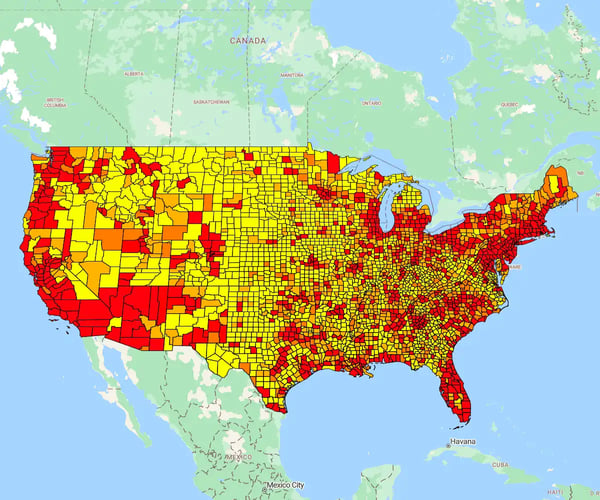
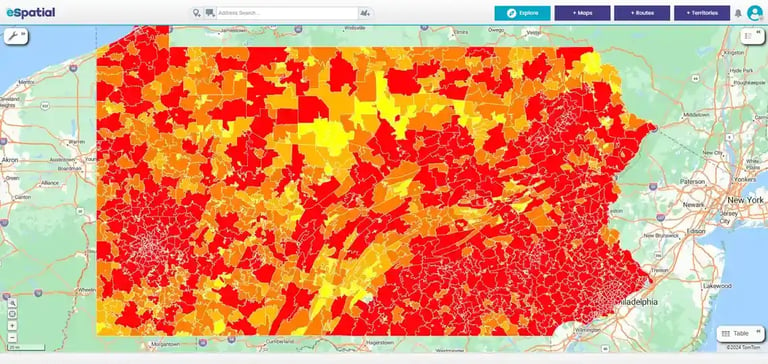
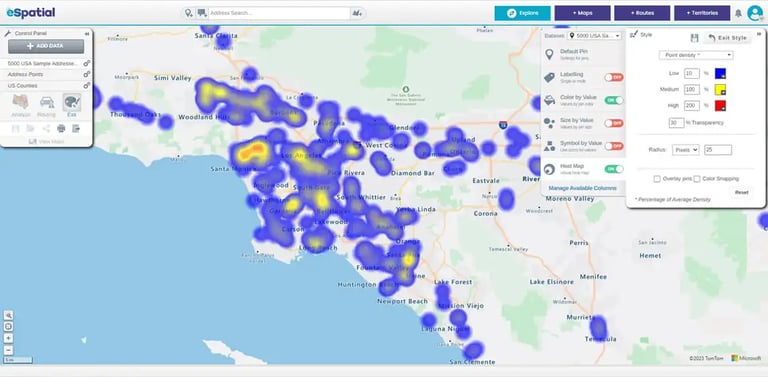
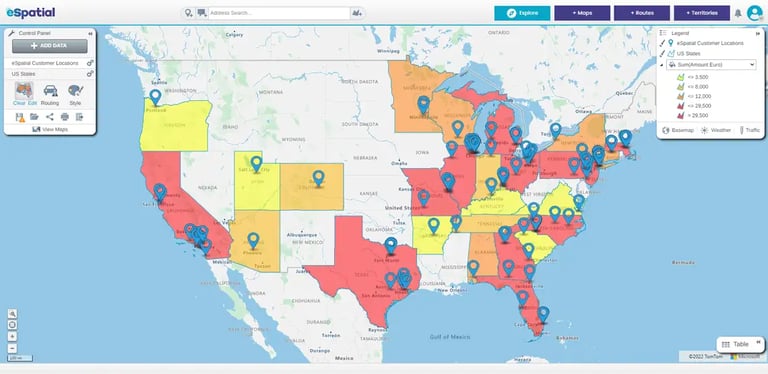
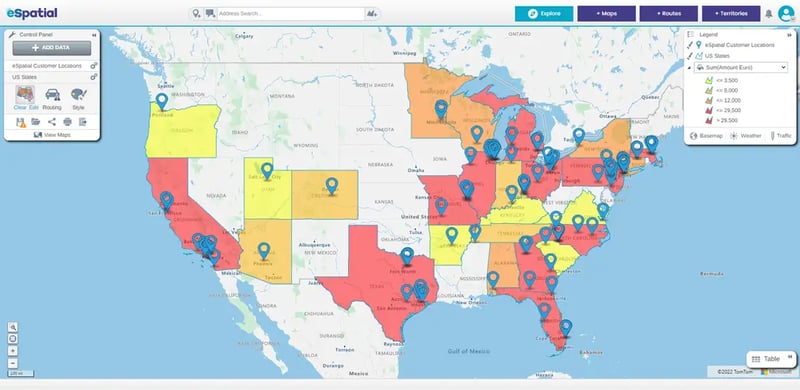
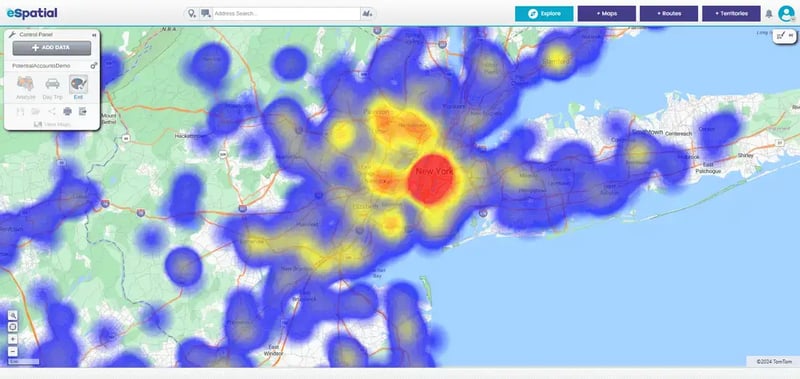
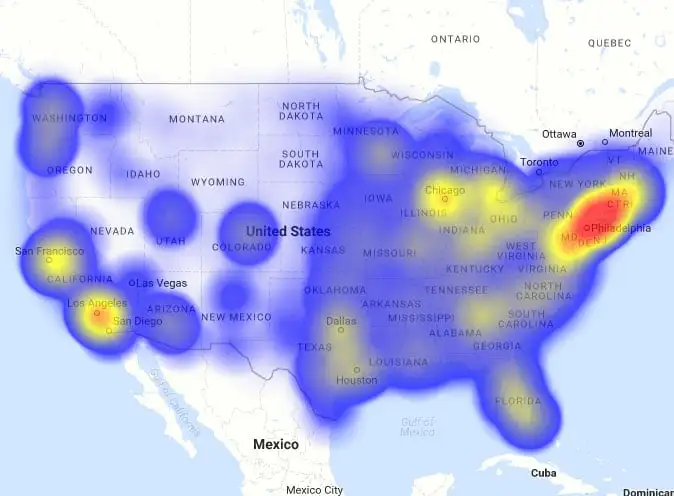
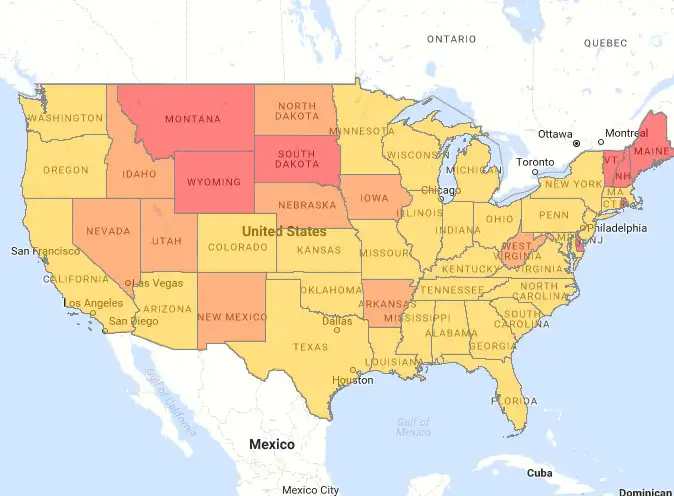
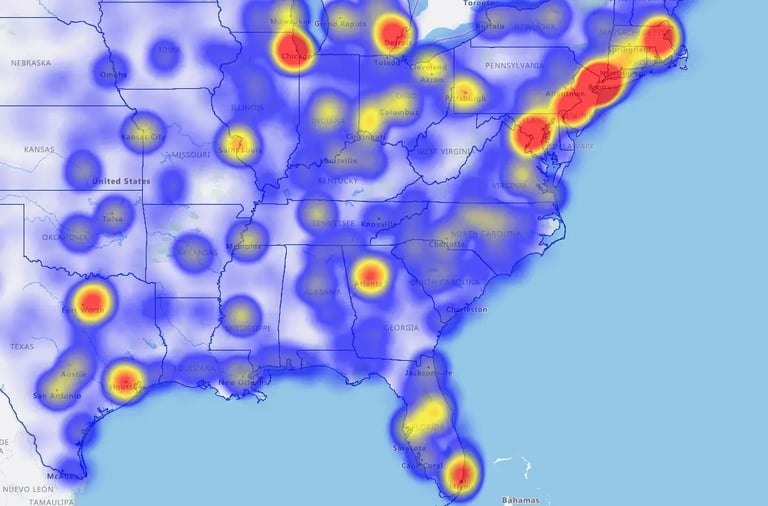
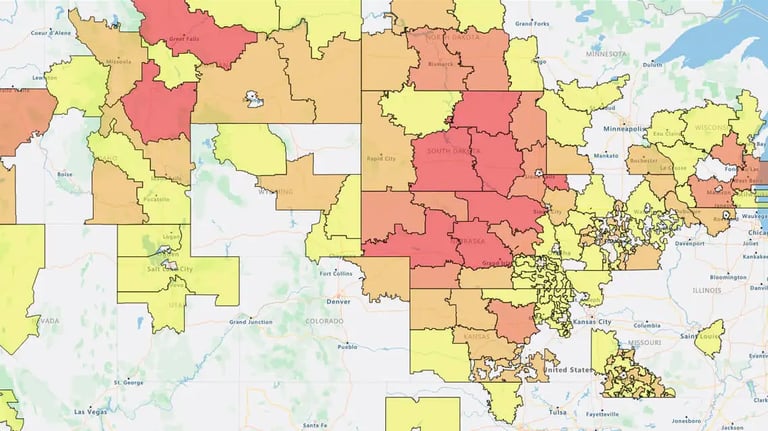
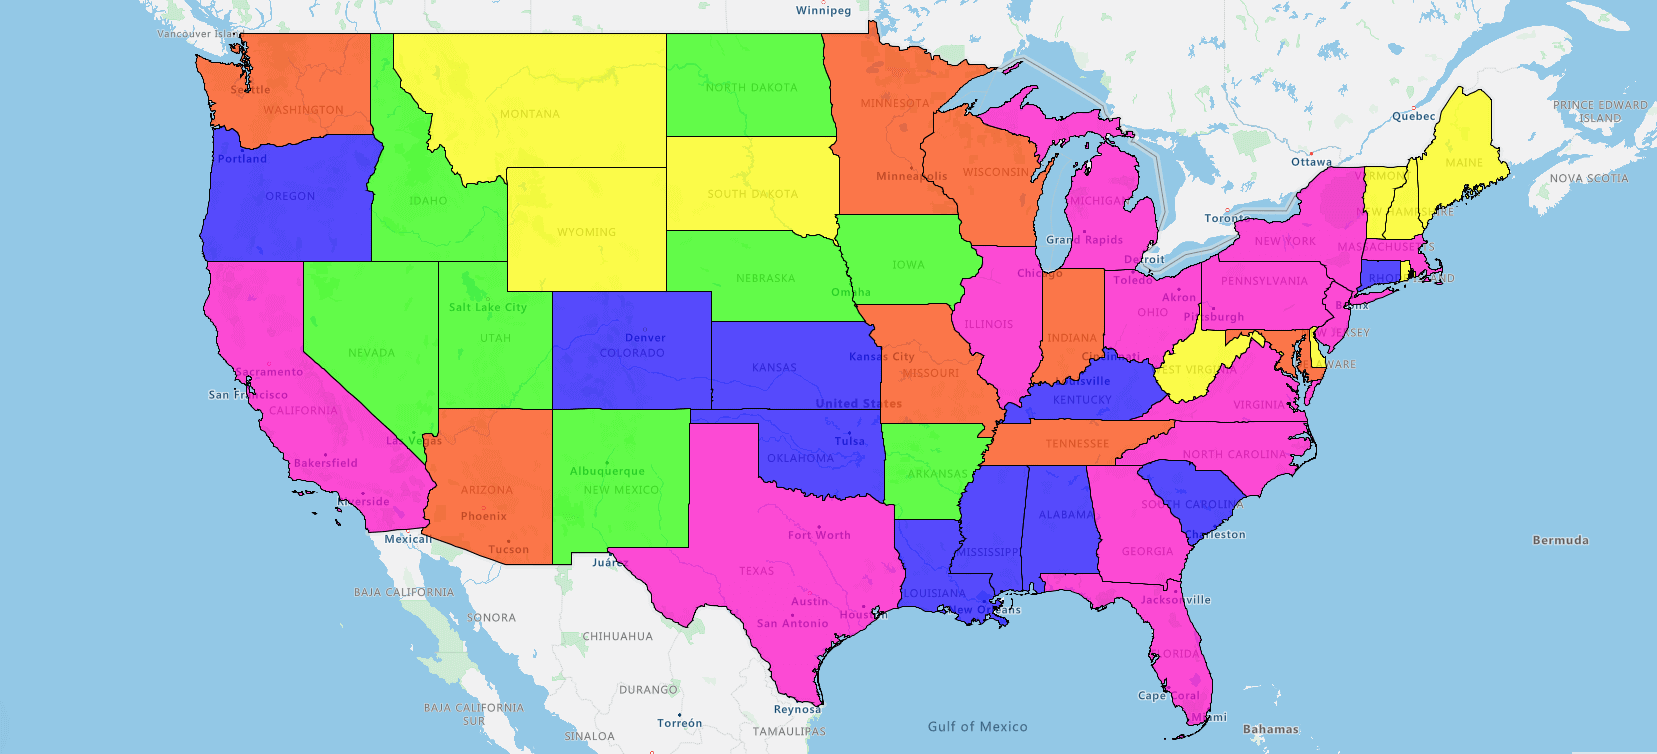
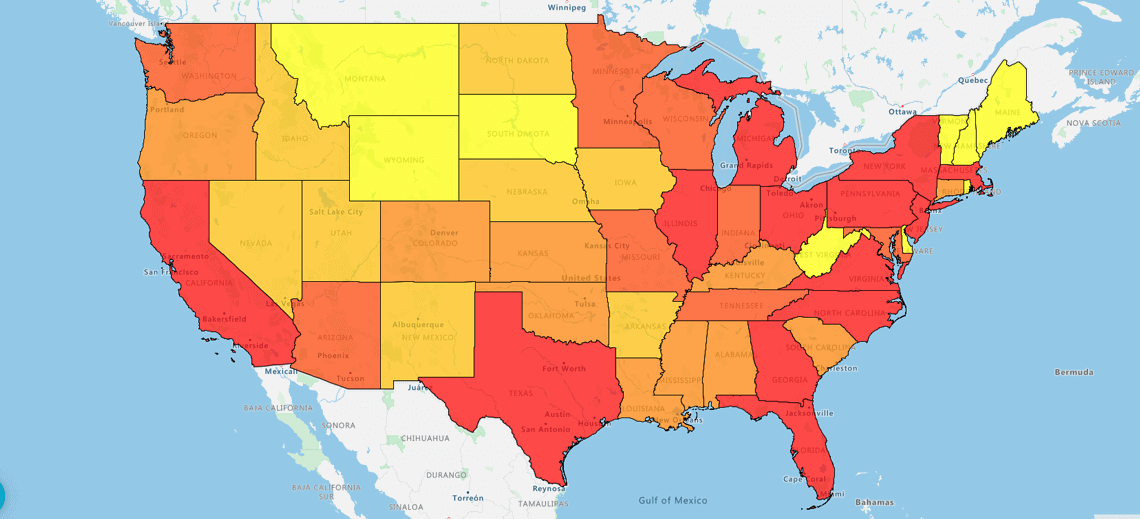
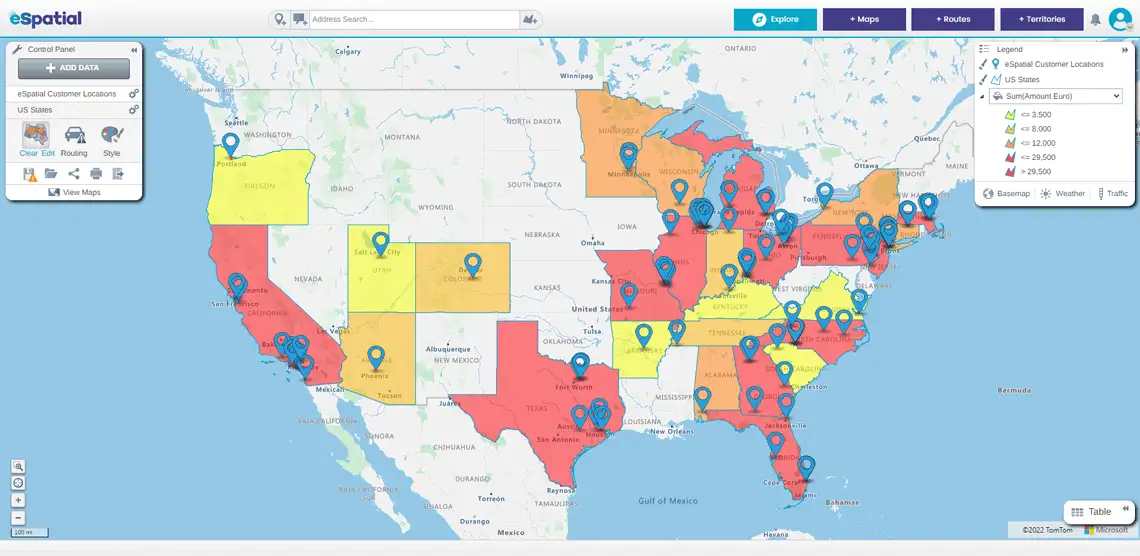
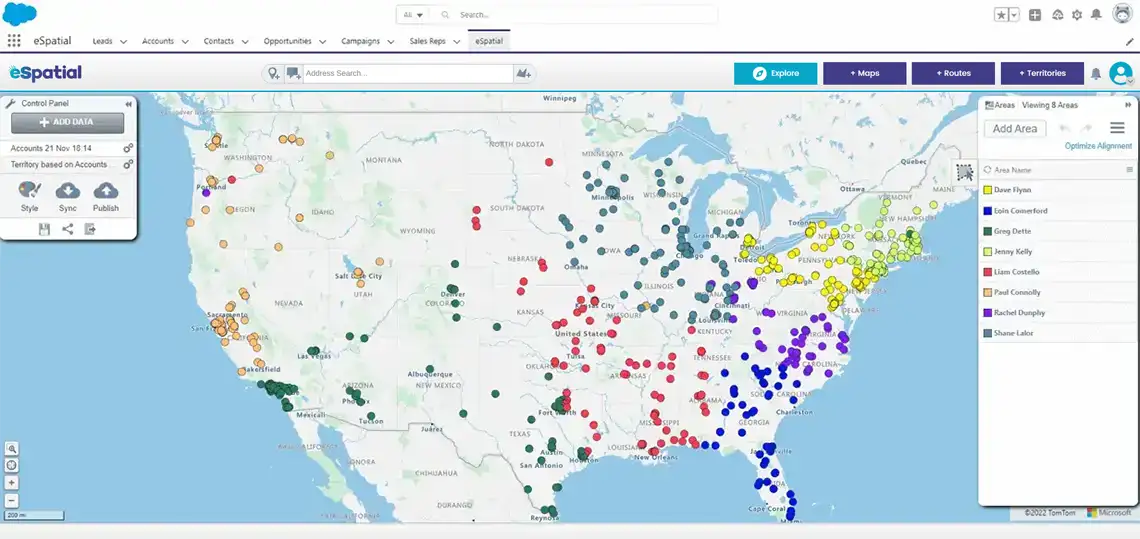
Enterprise revenue operations and sales leaders use heat maps to transform location data into actionable field strategy. By visualizing customer density, territory coverage, and regional performance, teams optimize rep routes, eliminate pipeline overlap, target marketing spend, and identify untapped market expansion opportunities.
Turning sales data into geographic intelligence helps revenue teams stop guessing where market demand lives. Here is how enterprise organizations apply heat maps across nine critical operational workflows:
1. Spot Customer Clusters & Office Positioning
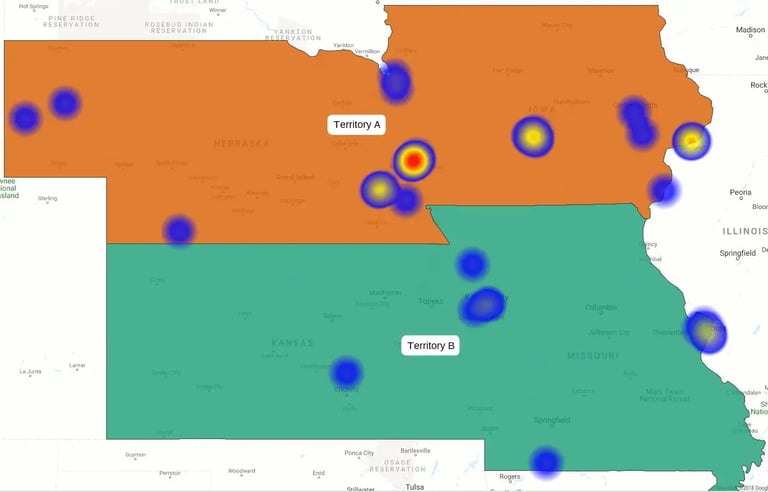
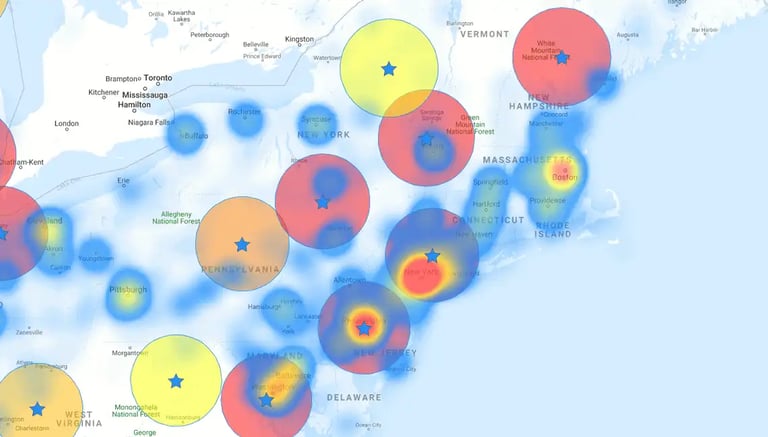
Map customer concentration against physical branch locations to reveal coverage gaps. A Kansas sales team mapped target customer density against their physical offices, identifying unserviced prospect clusters and driving a 14% lift in meeting volume.
2. Refine Service & Distribution Networks
Position fulfillment hubs and service centers directly where customer demand is highest. Moving assets closer to high-density clusters cuts travel time and lowers operational costs.
3. Target High-ROI Marketing Campaigns
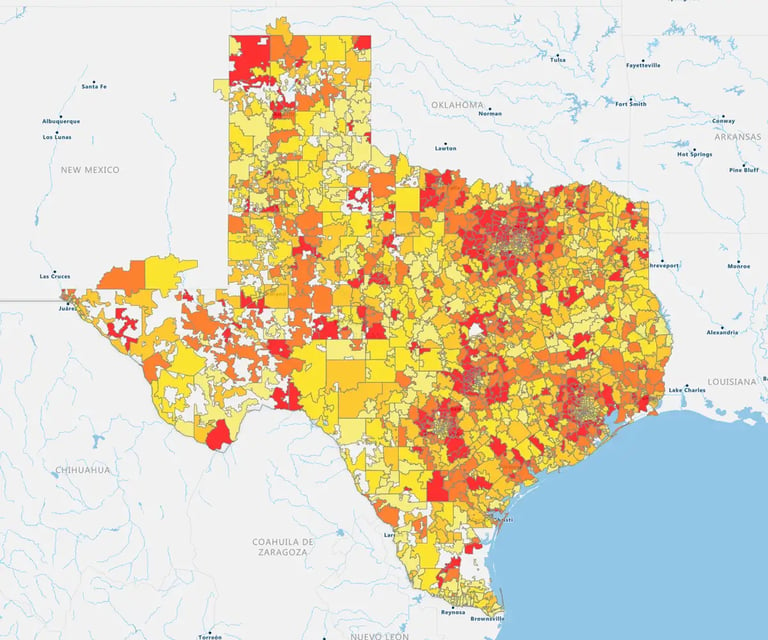
Layer demographic datasets over regional performance maps to eliminate wasted ad spend. A Texas fashion retailer mapped high-value ZIP codes to place outdoor billboards precisely where target buyers lived, achieving a 23% lift in campaign ROI.
4. Pinpoint Franchise & Retail Expansion
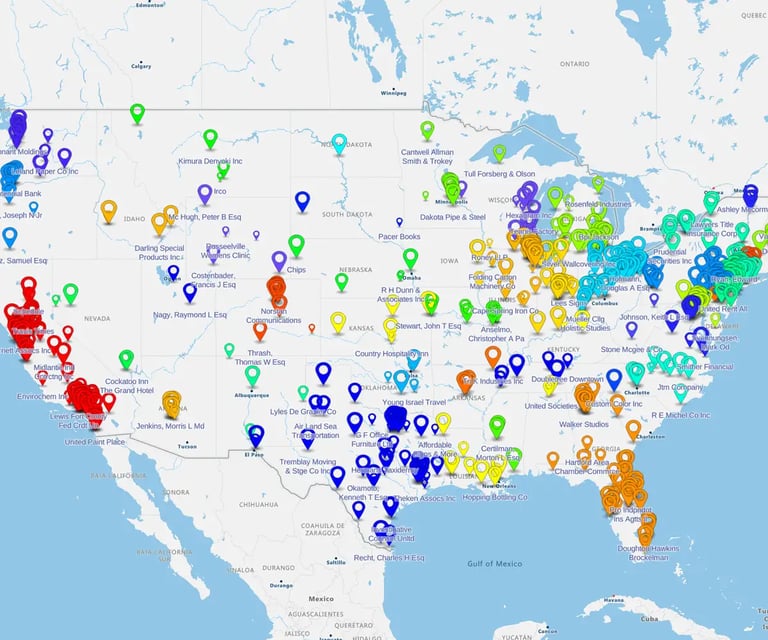
Overlay physical store locations (pins) with customer inquiries (heat markers). Seeing intense heat with no nearby store pins signals an immediate high-probability market for expansion.
5. Investigate Churn Risk & Customer Sentiment
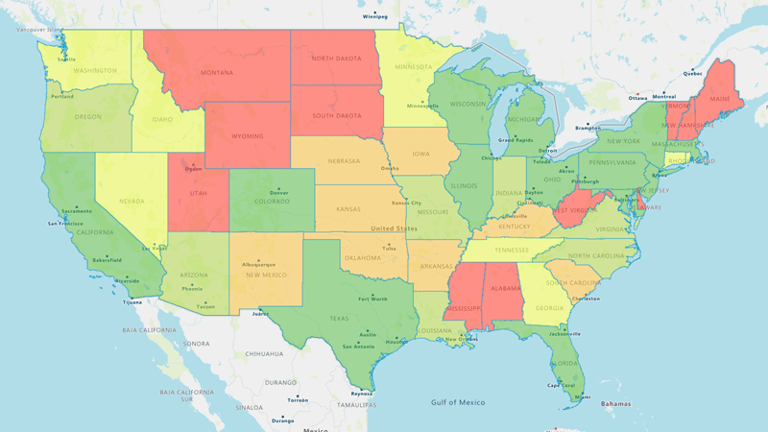
Color-code account satisfaction scores across regions to catch risks early. Green highlights account health, while sudden red spots alert leadership to intervene with executive support before churn occurs.
6. Isolate High-Profit Customer Pockets
Filter maps by profit margin and customer lifetime value rather than raw revenue alone. This ensures your top field reps spend time nurturing high-margin accounts instead of chasing low-value volume.
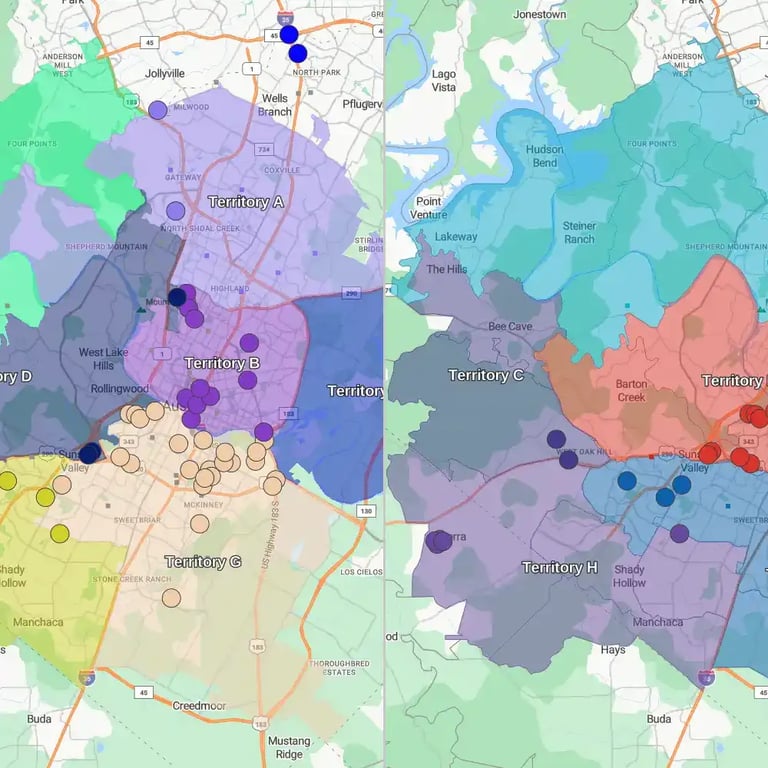
7. Optimize Sales Coverage & Eliminate Overlap
Compare active customer accounts against assigned sales rep boundaries. Spotting coverage gaps and overlapping territories stops reps from competing for the same accounts.
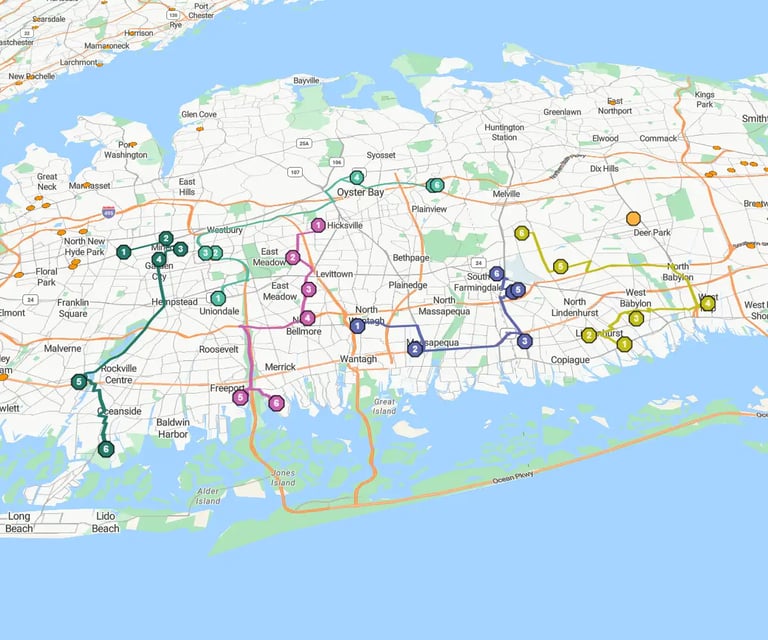
8. Ignite Field Sales Route Efficiency
Provide field reps with dynamic cluster maps so they can plan focused daily prospecting trips. Grouping visits within dense pockets replaces cold calling with high-impact field meetings.
9. Evaluate Territory Performance Fairly
Judge rep performance against market density and drive times rather than revenue alone. Factoring in geographic reality helps managers coach fairly and rebalance workloads, driving up to a 12% boost in team close rates.