

Quick answer
If you are a sales or operations leader managing your territory alignments using Microsoft Excel or Google Sheets, your strategic growth plan is missing a critical component. Geography. You are running a multi-million-dollar enterprise on tools designed for data collection, not mapping or spatial intelligence. While your spreadsheets show neat rows, clean columns, and beautifully balanced quotas on paper, the physical reality on the ground could be chaotic.
One structural failure hidden inside your spreadsheets is territory overlap. Because you cannot see geography in rows of text, your sales reps are actively tripping over one another, burning through capital, underutilized, and leaving millions of dollars in net-new revenue on the table. Independent research from global management consultancies reveals that proper territory design increases top-line revenue by 2% to 7% instantly without adding a single unit of headcount.
Advanced digital approaches that eliminate overlap can drive revenue up by 7% and slash administration by up to 95%. By relying on spreadsheets, you are paying an unacknowledged administrative tax that caps your company's potential and drains your sales productivity.
1. Anatomy of a Blind Spot:
Defining Territory Overlap
To understand territory overlap, you must first discard the comfort of your spreadsheet data. Territory overlap occurs when multiple sales representatives are assigned, either explicitly or implicitly, to the same geographic area, account tier, or vertical market segment without clear, mutually exclusive boundaries.
In a spreadsheet, you assign territories by lists of ZIP codes, counties, or states. It looks clean. Rep A gets ZIP code 90210; Rep B gets 90211. However, spreadsheets completely ignore geography, account density, and logistical realities like drivetime.
The 3 Variants of Overlap
- Pure Geographic Overlap: Occurs when boundary lines are loosely defined or based on outdated historical agreements. Reps physically cross paths on the same highways to visit different accounts on the same block, completely wasting travel budgets and selling hours.
- Account-Level Poaching: Occurs when a large corporate account has a headquarters in one rep's territory but multiple purchasing locations or subsidiaries in another's. Without spatial mapping, both reps claim ownership, resulting in duplicate outbound efforts and internal conflict over commissions.
- Multi-Layered Vertical Friction: Occurs when you overlay a vertical-market model (e.g., healthcare vs. manufacturing) on top of a geographic model without cross-referencing spatial density. You end up sending your highest-paid enterprise reps deep into a territory owned by a mid-market field rep, muddying the waters for your prospects.
The Reality Check:
Your spreadsheet assumes that a ZIP code is a static box where accounts are evenly distributed. In reality, accounts cluster intensely around transport links, commercial parks, and urban centres. Your spreadsheets are blind to these clusters, forcing reps to over-penetrate certain areas while completely ignoring others.
2. The Spreadsheet vs. The Map: Visualising the Disruption
If you look at your sales data in an Excel sheet, everything balances. You see twenty columns of reps, each assigned exactly 50 target accounts and an equal slice of historical revenue. It looks fair. It looks optimized.
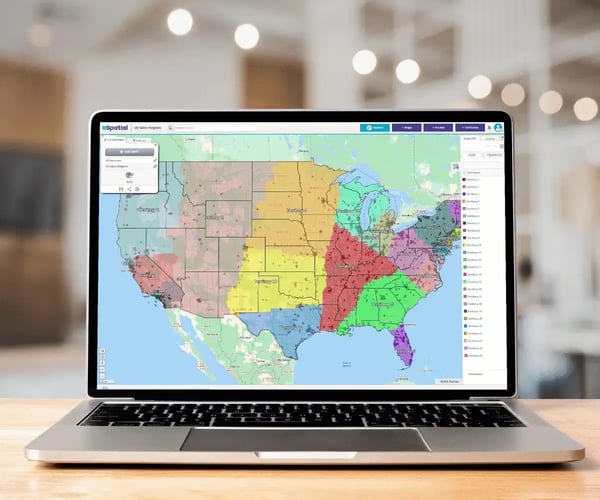
Now, imagine uploading that exact spreadsheet into a professional sales territory mapping platform. The clean rows vanish, replaced by a visual representation of your efficiency. When you project spreadsheet data onto a map, the structural inbalances become instantly visible:
The Realities a Map Uncovers
- The "Spaghetti" Territory: You will see lines representing Rep A’s daily travel path criss-crossing directly through Rep B’s territory. Rep A is driving two hours past twenty high-value prospects assigned to Rep B just to visit a legacy account that yields negligible margin.
- The No-Man's Land: You may find vast, high-potential geographic corridors completely devoid of sales activity. Because spreadsheets don't show proximity, these "white spaces" sit right under your nose, completely unworked, while your competitors quietly strip them clean.
- The Boundary Collision Zone: You will see multi-coloured clusters where three or four reps are calling on accounts within the exact same commercial business park. This happens because your spreadsheet list relied on incomplete billing data rather than physical shipping or operational locations.
Your sales operations team is spending weeks every quarter manually formatting these spreadsheets. It feels like rearranging deckchairs on a sinking ship. A mapping engine like eSpatial automates this entire process, transforming weeks of manual data manipulation into minutes of algorithmic rebalancing.
3. The Quadruple Threat: How Overlap Destroys Value
Territory overlap is not an aesthetic flaw; it is a direct drain on your profits. It manifests as an invisible operational tax across four major areas of your business:
I. Severe Revenue Leakage
When territories overlap, accountability dies. When two reps share an ambiguous boundary, high-value outbound leads fall straight through the cracks. Rep A assumes Rep B is handling the account; Rep B assumes the same. Meanwhile, the prospect gets cold-called by a competitor who has a clearly defined, tightly run territory.
Furthermore, reps operating in overlapping areas frequently resort to "double-discounting", lowering prices unnecessarily to secure a deal quickly before their internal colleague sweeps in and claims the account.
II. Mass Disruption of Sales Productivity (The Travel Drain)
Your field resources are spending more time behind the wheel than in front of buyers. When territories overlap geographically, travel paths become highly inefficient.
Industry data shows that eliminating territory overlap and optimizing routes increases a sales rep's actual selling hours by 20% in the first year alone while dropping localized travel costs by 15%.
If your reps are spending 40% of their week driving inefficient, overlapping routes, you are paying full-time salaries for part-time market coverage.
III. Destructive Internal Friction and Commission Disputes
Nothing destroys a sales culture faster than ambiguous compensation boundaries. When territories overlap, your Sales Leaders and Revenue Operations managers waste dozens of hours every month arbitrating commission disputes.
You end up double-paying commissions on a single deal just to keep the peace in your sales team, or worse, you alienate top performers who leave your organization out of sheer frustration. Your spreadsheet is actively driving up your sales turnover statistics.
IV. Customer Confusion
Imagine being a procurement manager at a major mid-market target. On Tuesday, Rep A calls you with one pitch and pricing structure. On Thursday, Rep B from the exact same company calls you, entirely unaware of Rep A's intervention, offering a different configuration.
This isn't just embarrassing; it signals a total lack of internal operational competence. It breaks buyer trust before the discovery phase is even completed.
4. The Solution: Algorithmic Sales Territory Optimisation
Fixing this problem requires a hard pivot away from manual spreadsheet design and toward dedicated sales territory mapping and optimization software. The transition requires a structured, step-by-step approach to rebuild your go-to-market architecture:
Geocode Your Entire Market Universe
You must pull all account data, active customers, lost opportunities, and cold prospects, out of your CRM and spreadsheets, and pass them through a mapping engine like eSpatial.
This converts flat addresses into map locations exposing the actual density of your market independent of artificial political boundaries like state or ZIP lines.
Establish the True Workload Metric
Spreadsheets balance on total account count or historical revenue. This is a critical failure. A territory with 50 accounts spread across a 300-mile radius requires vastly more effort than a territory with 50 accounts located in a single metropolitan skyscraper.
eSpatial's Mapping software calculates true workload balance, factoring in travel time, required meeting frequencies, and sales cycle complexity to ensure every rep has an achievable, equitable patch.
Run Algorithmic Boundary Optimisation
Instead of drawing lines based on "gut feel," allow eSpatial’s optimization algorithms to generate territory boundaries. The engine applies mathematical models to minimize travel times, eliminate overlapping boundaries entirely, and distribute market potential evenly.
You can instantly run "what-if" scenarios to model structural changes before making a single organizational shift.
Export Direct to CRM for Rigid Governance
Once optimized, you can execute your plans. The new designs lock down lead assignment rules. If an account falls geographically within Rep A's boundary, easily assign it to Rep A. No debate, no poaching, and zero overlap.
5. Quantifiable Financial Impact and Projections
To justify moving away from your current spreadsheet model, you must evaluate the hard financial metrics. Below is an independent financial impact projection for a typical mid-market B2B organization running a team of 30 field sales representatives with an average quota of $1,000,000 per rep.
Mid-Market Performance Impact Matrix
|
Metric / Operational Area |
Current Spreadsheet Model Performance |
Post-Optimization Performance (With eSpatial) |
Projected Net Financial Impact |
|---|---|---|---|
|
Total Sales Team Revenue |
$30,000,000 baseline |
$30,600,000 to $32,100,000 (Based on a 2%–7% growth model via overlap elimination) |
+$600,000 to +$2,100,000 in net-new top-line revenue |
|
Active Selling Hours per Rep |
~25 hours per week (Rest eaten up by travel and admin) |
~30 hours per week (20% increase in customer-facing time via optimized routing) |
Unlocks the equivalent capacity of 6 additional full-time reps without hiring costs |
|
Annual Travel & Mileage Expenses |
$240,000 ($8,000 per rep average) |
$204,000 (15% reduction via elimination of overlapping routes) |
+$36,000 saved straight to the bottom line |
|
Quarterly Territory Planning Time |
80 hours of executive/Ops time per quarter |
4 hours per quarter using automated, algorithmic rebalancing |
76 hours saved per quarter; Ops resources redirected to proactive pipeline analysis |
All of the above excludes the cost of rep turnover due to imbalanced territories.
The Hard Choice Facing Sales Operations
Remaining on spreadsheets is proven to lead to market under-performance. You are unintentionally funding internal cross-border conflicts between your reps, paying for redundant mileage, and confusing your target buyers.
Your team will tell you they "have it under control" in Excel because that is the tool they know. They could be wrong.
They cannot manage territories on a flat grid. Transitioning to an algorithmic territory mapping framework is not a soft software upgrade—it is a mandatory strategic correction required to protect your margins, unlock hidden capacity, and capture the full revenue potential of your market.
Ready To See What Your Spreadsheets are Hiding?
Stop letting invisible territory overlap drain your profits and frustrate your top performers. Upload your data into eSpatial and transform weeks of manual spreadsheet manipulation into minutes of algorithmic rebalancing.
No credit card required