
Quick answer
Sales leaders know that field sales reps routinely lose 15% to 40% of their working day to unoptimized "windshield time" because of poor territory designs. When sales operations managers upgrade to dynamic proximity analytics, field efficiency shifts from a reactive game into a proactive, measurable growth driver. Transitioning from basic maps to integrated territory mapping workflows helps sales teams reclaim lost selling hours, balance rep workloads, and capture hidden or untapped market potential.
What Is a Radius Map and How
Does It Drive Business Strategy?
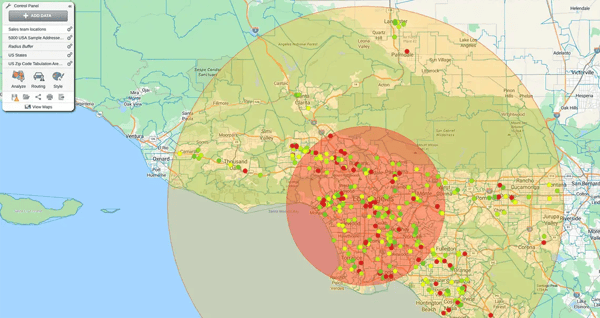
A radius map (also known as a proximity map or buffer map) is a location intelligence tool that draws radial boundaries or travel-time perimeters around central points to isolate customer location data. Businesses use proximity mapping to visualize customer density, eliminate territory overlaps, analyze market coverage gaps, evaluate new sites, and optimize field operations.
At its core, a radius map translates dense spreadsheet rows into clear visual boundaries on an interactive map. Sales operations leaders can instantly “see” where customers cluster and where coverage gaps exist. That leads to new insights, which helps you make more confident strategic decisions. Modern cloud mapping tools allow teams to overlay live account locations directly onto radial zones, giving revenue leaders immediate visibility into market saturation.
When applied to commercial strategy, proximity analytics turns passive location data into active revenue execution. Research from the Alexander Group shows that structured territory design yields a 10% to 20% increase in sales productivity. By creating compact, optimized distance boundaries around key business hubs or rep home offices, companies ensure accounts are distributed fairly while minimizing unnecessary travel overhead. So, more sales, less travel time.
Customer Density Analysis
Plot account pins around central hubs to uncover regional concentration and high-value customer clusters.
Territory Overlap Elimination
Identify boundary conflicts between field reps to establish fair, workload-balanced quotas.
Coverage Gap Identification
Spot underserved markets and prospect clusters sitting outside current territory designs.
Site Selection &
Trade Area Analysis
Model "what-if" scenarios to evaluate market demand before opening new locations, preventing sales cannibalization across existing sites.
Competitor Benchmarking
Overlay competitor data against your operational boundaries to map rival spheres of influence, defend high-risk accounts, and capture market share.
Distance vs. Drive-Time Radius Which Proximity Analytics
Model Fits Your Operations?
A distance-based radius draws a straight-line circle around a central point based on air miles. A drive-time radius maps boundaries using actual road networks, speed limits, and traffic patterns. Distance maps work best for quick market checks, while drive-time maps are essential for planning real-world sales trips, territory alignments, and deliveries.
Drawing a simple circle on a map is fast, but it ignores real-world travel. A prospect might look close "as the crow flies," but taking a bridge, winding roads, or heavy highway traffic into account can double the actual travel time. That insight is completely absent from your spreadsheet analysis and will only come to light when your field team executes the plan. Choosing the right approach depends on whether you need a quick high-level view or an accurate daily plan for your team.
|
Feature |
Distance Radius |
Drive-Time Radius |
|---|---|---|
|
How It Calculates |
Draws a perfect circle based on air miles |
Maps irregular boundaries using real roads and speed limits |
|
Primary Advantage |
Fast set-up for quick market screening |
Highly accurate for daily field planning and customer visits |
|
Best Used For |
National coverage checks, broad territory boundary setup |
Field sales routing, technician service zones, delivery SLAs |
|
Key Limitation |
Ignores natural barriers, traffic, and winding roads |
Requires slightly more detailed location data to map |
When to Use Each Model
- Use Distance Maps when you want to quickly see how many customers sit within 20 miles of a new branch or warehouse
- Use Drive-Time Maps when you need your sales or service reps to spend less time driving and more time sitting in front of buyers—or trucks making more deliveries
No credit card required
How Does Salesforce Integration Upgrade Basic Radius Maps into Territory Workflows?
Integrating radius mapping with Salesforce transforms static geographic circles into real-time operational workflows. Native bi-directional synchronization allows revenue teams to filter live accounts within radial boundaries, reassign territories dynamically, and update opportunity ownership without manual spreadsheet exports.
Static maps built from spreadsheet exports age instantly. The moment a new lead comes in or an account changes status, your map becomes outdated. Connecting your mapping software directly to Salesforce fixes this. Your map pulls live account, lead, and deal data straight from your CRM, updating customer pins automatically inside your travel boundaries.
This turns simple proximity checks into active territory management. Instead of spending hours cross-referencing zip codes, sales operations managers can reassign accounts on screen and sync the updates back to Salesforce in a click.
Live Data
Mapping
See open opportunities, deal sizes, and account owners update inside your radius zones automatically.
Instant Territory Updates
Reassign accounts or rebalance boundary lines on the map without exporting or re-uploading CSV files.
Cleaner Sales
Pipelines
Ensure new leads are routed to the nearest rep instantly based on actual travel distance rather than arbitrary zip codes.
How Do Sales Operations Leaders Use Radius Maps to Eliminate Windshield Time and Rebalance Quotas?
Sales Operations leaders leverage drive-time radius analytics to replace arbitrary geographic boundaries with workload-balanced territories. Placing reps within 30-to-60-minute travel zones reduces windshield time by up to 40%, increases face-to-face selling hours, and ensures equal revenue potential across quotas.
Driving between scattered meetings drains valuable selling time. With suboptimal territory designs, field reps spend more time staring at windshields than talking to prospects. Proximity analytics fixes this by building territories around actual drive times and customer density. By grouping high-value accounts into realistic travel zones, reps spend far less time on the road and far more time closing deals.
This also solves the political headache of quota assignment. Instead of giving reps equal geographic sizes with unequal customer numbers, sales leaders can equalize workload and market potential across the entire team. That can directly impact rep turnover.
Cut Windshield Time
Reduce travel overhead by up to 40% and convert wasted road hours into active meeting time.
Balance Rep Quotas
Ensure every team member gets fair access to high-value opportunities within their drive zone.
Optimize Field Expenses
Lower mileage costs and travel expenses across the entire sales team.
How Does Radius Mapping Fit into Your Complete Sales & Operations Workflow?
Radius mapping is step one in a complete location intelligence workflow. Your radius map provides the initial spatial insights (the “aha moments”); territory mapping and optimization balances account loads; and route optimization turns those boundaries into turn-by-turn schedules that maximize rep face time.
Key takeaway: Optimizing field routes before you optimize territory designs leads to inefficiencies and lost productivity.
A radius map is an analytical starting point, not the final destination. While drawing radius circles gives you instant insights and proof points, true operational value comes from connecting those insights into a broader end-to-end workflow. Investing in a comprehensive mapping platform links three essential tools together seamlessly:
Analyze Radius & Proximity Mapping
Uncover customer density, identify market gaps, and filter account data within realistic drive-time boundaries.
Optimize Territory Design & Alignment
Take those proximity insights to balance workloads, eliminate territory overlap, and set fair rep quotas.
Execute Field Route Optimization
Convert balanced territories into daily, turn-by-turn routes that eliminate wasted mileage and keep reps in front of buyers.
This three-step synergy transforms raw location data into a repeatable revenue process for sales and operations teams.
Frequently Asked Questions
Yes. eSpatial allows you to plot multi-ring radius buffers (e.g., 5-mile, 10-mile, and 25-mile concentric zones) or multiple independent center points simultaneously. This enables sales and operations teams to analyze nested service tiers, compare representative coverage overlap, and spot unserved market gaps across regions.
Yes. The terms are used interchangeably in location intelligence. Both proximity maps and radius maps use circular buffers or irregular drive-time boundaries to analyze spatial relationships between central points (hubs, reps, stores) and surrounding data points (customers, leads, competitors).
Straight-line radius mapping draws a perfect circle based purely on physical distance, ignoring geography and transit networks. Drive-time radius mapping uses real-world road infrastructure, speed limits, and traffic patterns to generate accurate, irregular travel boundaries. Drive-time modeling provides realistic service-level agreements (SLAs) for field technicians and sales reps.
eSpatial offers a native integration with Salesforce, enabling direct sync between your CRM records and mapping interface. You can plot accounts, contacts, and open opportunities inside radius buffers, apply custom field filters, and push territory updates or account reassignments back to Salesforce in real time.
Radius mapping reveals account density and rep travel constraints. By visualizing customer clusters within specific drive-time perimeters, Sales Operations managers can reassign boundary accounts from overloaded reps to under-indexed reps, balancing workload equity and driving a 10% to 20% increase in sales productivity.
Radius mapping is step one of a complete workflow. Proximity analytics gives you the initial insights, but maximum efficiency requires moving from radius analysis to territory optimization (balancing workload and quotas) and route optimization (creating efficient daily travel paths).