4.8/5 of 53 reviews
4.3/5 of 38 reviews

Pin Mapping Software for Visual Location Intelligence


Managing with spreadsheets can cause overlapping territories, bloated windshield time, and lost revenue. Transforming addresses into dynamic pin maps turns location data into an actionable operational advantage.

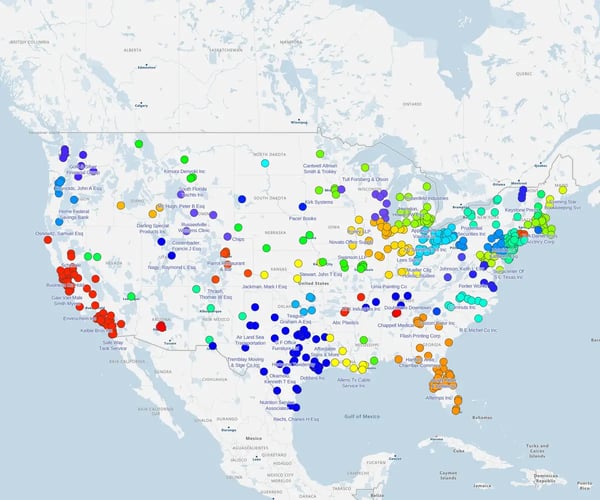
Pin map, USA How to create a pin map
Video transcript for How to create a pin map

Creating a pin map from Excel is easy. Just take your spreadsheet, import it into eSpatial. The system will automatically take all of your data and plot it on a map.

And if you want to style it, change the colors of the pins, or the size of the pins, you can easily do that here on the right-hand side.

And there's your pin map.

How to create a pin map

Our Customers Love Mapping With eSpatial

  • RE/MAX logo
  • FedEx logo
  • Volvo logo
  • LG Electronics logo
  • Henkel Corporation logo
  • Continental Tire logo

What Is Pin Mapping Software and
How Does It Transform Raw Location Data?


Pin mapping software is a location intelligence tool that converts raw address spreadsheets, postal codes, or CRM records into interactive maps. By visualizing geographical points, business teams can instantly spot customer density, regional sales trends, and unserviced market coverage gaps.

Spreadsheets hide geographical relationships in endless cells, making spatial patterns impossible to catch. Dynamic pin maps reveal where activity clusters and where coverage thins out in seconds. That insight is a gamechanger.

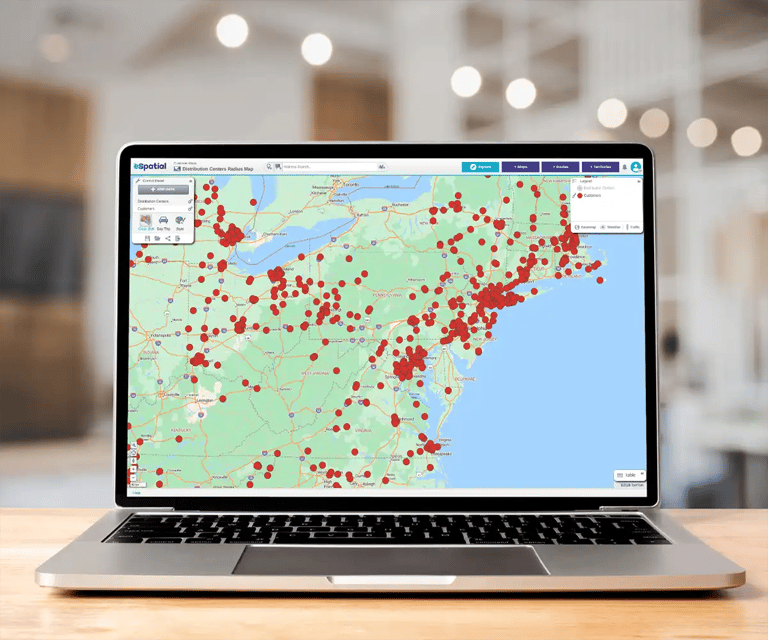
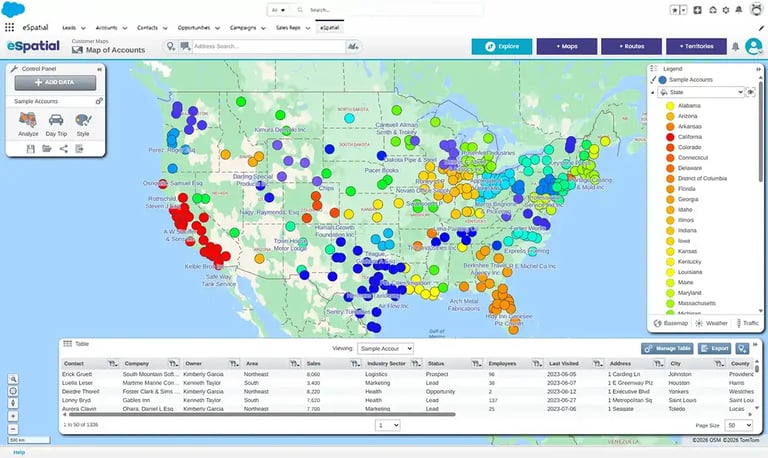
Pin map on a laptop screen

Different operational teams leverage pin mapping software to solve distinct location challenges:

  • Sales Teams: View customer locations side-by-side to identify unassigned accounts, competitor locations, plan campaigns and spot regional expansion opportunities
  • Operations & Supply Chain: Compare customer clusters against warehouse hubs to optimize logistics and minimize delivery costs
  • Marketing Teams: Plan localized ad spend and select event venues based on high-density account clusters
  • Real Estate & Field Services: Visualize property portfolios, service coverage zones, and active job site proximity

How Do You Map Large Datasets
Without Visual Clutter?


Automated pin clusters solve the problem of mapping large datasets. Instead of piling thousands of markers on top of each other, pin mapping software automatically groups high-density addresses into clear summary badges. Zooming into a cluster dynamically expands the map to reveal specific accounts and locations.

Plotting thousands of customer addresses on a base map often creates an unreadable wall of overlapping dots. When markers stack directly on top of each other, crucial account details get buried and decision-makers miss key regional insights. Automated pin clustering solves map overcrowding by instantly organizing dense location points into clean visual summaries.

  • Summarize: Instead of a chaotic pile of markers, view a single numeric badge (such as "10" or "150") representing a high-density ZIP code or metro area
  • Drill Down: Click or zoom into any summary icon to instantly expand the cluster, exposing exact street addresses and individual pin details

Data Density Challenge

Spreadsheets

Raw Unclustered Maps

eSpatial Pin Clustering

10,000+ Account Rows

Hides spatial trends in endless cells

Creates unreadable, overlapping dots

Groups points into dynamic summary badges

Co-located Addresses

Indistinguishable rows

Pins stack invisibly on top of each other

Zooming expands clusters to reveal every pin

Time-to-Insight

Hours of pivot-table analysis

Confusing visual noise

Under 5 seconds to spot regional hot spots

Get Started With eSpatial Today


Our team is here to help you every step of the way

How Can Multi-Layer Mapping Uncover
Hidden Market Relationships?


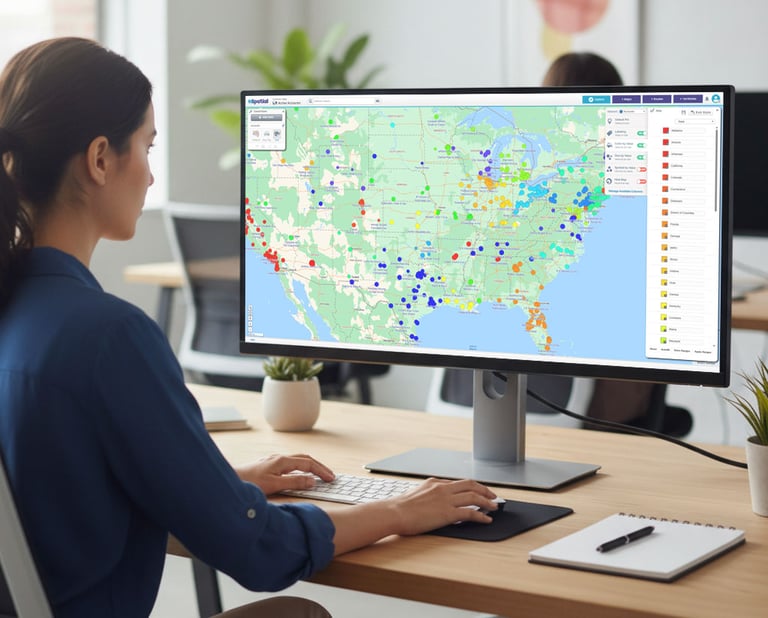
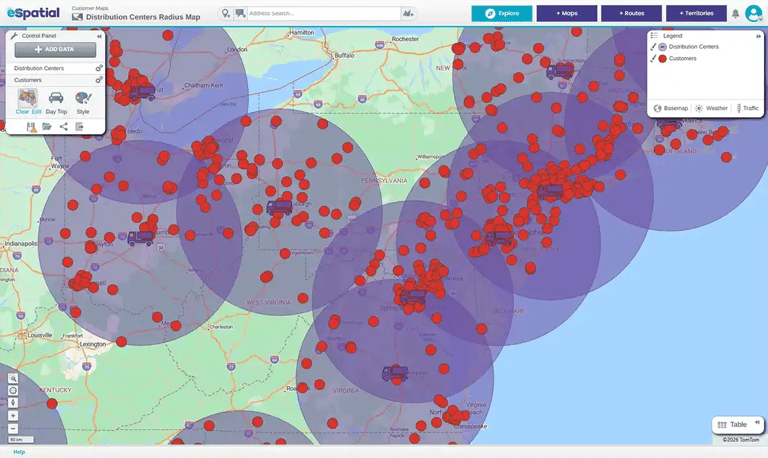
Multi-layer pin mapping overlays distinct datasets, such as customers, sales or field service rep locations, distribution centers, and competitors, onto a single map view. Color-coding and toggling individual layers exposes spatial relationships, account ownership conflicts, and underserved territory gaps that single-layer maps miss.

Woman reviewing pin map on a desktop computer
Radius map with pins overlaid on a map

Business drivers do not exist in isolation, and analyzing them on separate spreadsheets creates critical operational blind spots. Multi-layer pin mapping allows you to stack multiple data sources onto a single unified base map to see how assets, teams, and market forces interact.

  • Stack Datasets: Combine customer accounts, field sales rep locations, and regional distribution centers on a single map
  • Color-Code Contrast: Use distinct colors for each dataset or account tier to differentiate assets at a glance and spot coverage gaps instantly
  • Identify Whitespace: Overlay competitor locations against your customer footprint to reveal cold spots and untapped market expansion opportunities

How Do You Filter Spatial Data to
Isolate High-Value Accounts?


Spatial data is filtered by applying categorical or numerical rules to mapped dataset attributes. Users can instantly hide low-priority points and display specific target segments, such as past-due accounts, high-value prospects, or customers visited within a specific timeframe.

Default map views display every location at once, which can create unneeded noise when focusing on a specific operational goal. Filtering allows teams to strip away background clutter and focus on the exact records driving immediate business priorities.

Segment on
Demand

Instantly hide irrelevant pins to isolate call-ready leads, unassigned prospects, or accounts visited within the last year.

Prioritize
High Revenue

Filter locations by annual spend, transaction size, or account tier to highlight your top-performing customers visually.

Align Logistics
& Operations

Compare account locations directly against warehouse hubs to cut delivery costs and optimize service coverage.

How Do Interactive Pins Connect
Directly to Your CRM Records?


Interactive pins link map markers directly to your datasets. Clicking a pin opens a curated popup window displaying critical customer metrics and direct hyperlinks, enabling sales teams to update account records without leaving the map interface.

Static spreadsheets and standard CRM list views force sales reps to hunt through endless tabs just to gather basic account context. Interactive pin mapping bridges this gap by embedding real-time account intelligence directly into your map view.

Woman reviewing territory map in eSpatial for Salesforce
Pin map in eSpatial for Salesforce

Clicking a pin unlocks instant account context without breaking your operational momentum:

  • Data Context Popups: Click any marker to view essential details like assigned representative, annual revenue, open deal status, or last contact date
  • Bi-Directional Salesforce Integration: Jump straight to the underlying Salesforce account details directly from the pin popup to log meetings or update pipeline stages
  • Popup Curation: Toggle off internal system IDs and empty spreadsheet columns to keep popup windows clean and focused on high-value data

How Should You Style Pins for Colorblind
Accessibility and Visual Clarity?


Pins should be styled using high-contrast, colorblind-safe palettes (such as blue and orange), simple geometric shapes, and distinct icons. Scaling marker sizes based on numeric values allows readers to interpret location density and account value simultaneously.

Generic markers turn map legends into confusing puzzles. Styling pins strategically ensures that every stakeholder can read key account metrics directly off the map without constantly referencing raw spreadsheets. Custom pin styling builds visual clarity through three primary design techniques:

Colorblind-Safe
Palettes

Swap traditional red and green stoplight colors for high-contrast blue and orange palettes with white outlines, ensuring status maps remain clear for every team member.

Numeric
Size Scaling

Scale marker sizes proportionally based on account revenue, order volume, or deal size to highlight high-value accounts immediately.

Custom
Brand Icons

Upload clean company logos or distinct industry icons to categorize site types, vehicles, or account tiers for instant visual identification.

How Do You Share Live Interactive
Maps Across Revenue Teams?


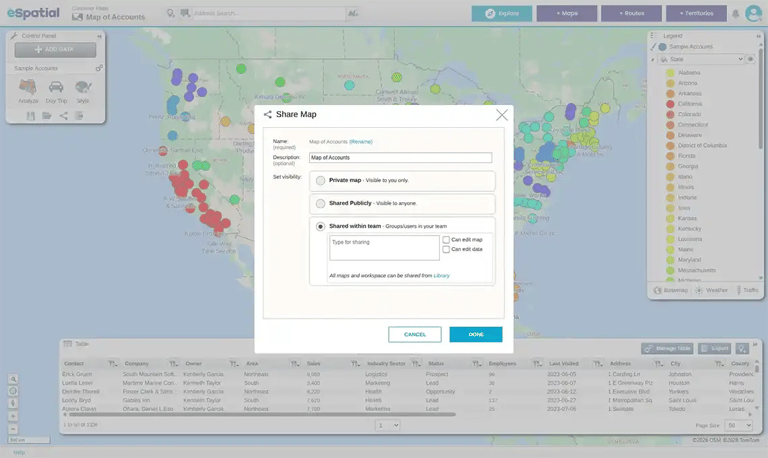
Live interactive maps are easily shared with other users securely, creating a shared link, or exporting PDF, JPG or Powerpoint. Shared maps allow stakeholders to zoom, filter, and interact with live location data on any device without disturbing the master dataset.

Publishing live, interactive pin maps gives every executive, sales manager, and field representative instant access to real-time location intelligence on their own devices.

2 people reviewing map settings on desktop computer
Pin map with share window open

Collaborating across revenue teams becomes seamless when everyone operates from a single, dynamic view:

  • Embed Anywhere: Publish interactive maps directly into company dashboards, intranet portals, or web pages for immediate executive visibility
  • Role-Based Collaboration: Share read-only interactive views with field teams so they can zoom and filter locations without risking edits to master datasets
  • Dynamic Data Refreshes: Update underlying spreadsheets or Salesforce records to keep shared maps accurate across the entire organization


How Do You Create a
Business Pin Map in 3 Steps?


To create an enterprise pin map, prepare a spreadsheet (.CSV or Excel) with address headers or connect your Salesforce account, sign up for a free trial, and upload your file. The software automatically geocodes location records into interactive, clickable map pins ready for styling.

Building a pin map requires zero specialized GIS training or coding. Transforming raw customer lists into location intelligence takes under five minutes.

1
Step 1

Prep Your Data or Connect Salesforce

Organize your spreadsheet with distinct column headers for location fields such as Street, City, State, and ZIP Code. Include non-location fields like annual revenue, account manager, or status to use for filtering and pin styling.

Alternatively, connect eSpatial directly to Salesforce to stream customer accounts directly into your workspace.

2
Step 2

Sign Up For Free (No Credit Card Required)

Sign-up for a free trial and create your account using your business email address to gain immediate access to the mapping platform.

No credit card is required, allowing your team to evaluate features with zero administrative barriers. Launch your trial and start converting flat address files into visual map intelligence instantly.

3
Step 3

Upload & Visualize

Explore the sample maps with data or upload your spreadsheet. Every location row transforms into a geocoded, clickable pin on an interactive map.

From there, apply automated clustering, customize colors, and group layers to begin uncovering actionable market insights.

How Does Pin Mapping Power Territory
Alignment and Route Execution?


Pin mapping provides the essential spatial baseline required for advanced location intelligence. Visualizing raw customer pins (Step 1) prevents the efficiency trap, ensuring that subsequent territory alignment (Step 2) and daily route planning (Step 3) are built on accurate account density and workload data.

Attempting to jump directly into territory management or route optimization without first visualizing raw account distribution creates a costly efficiency trap. Without baseline pin mapping, territory boundaries are drawn on guesswork and field routes are built across unbalanced, overlapping accounts. Treating pin mapping as Step 1 creates a clear operational foundation across a complete 3-step lifecycle.

1
Step 1

Visualise & Analyse With Pin Maps & Heatmaps

Plot raw spreadsheet addresses or Salesforce records to visualize account density and spot hidden regional trends. Overlaying heat maps on top of customer pins reveals revenue hotspots and unserviced market gaps instantly. This foundational step replaces guesswork with hard spatial context before any structural changes occur.

2
Step 2

Optimise Territories With Sales Territory Mapping

Feed your mapped location data into territory alignment tools to build balanced, fair geographic boundaries. Eliminating representative overlaps and balancing account workloads ensures every team member has an equal opportunity to hit quota. Visual territory design prevents internal friction and maximizes coverage across every region.

3
Step 3

Optimise Routes, Multi-Stop Field Dispatch

Generate optimized, multi-stop driving routes for field teams based on structured territories and prioritized account pins. Slashing windshield time by 15–20% reduces fuel costs and increases productive, face-to-face customer meetings. Efficient routing keeps field operations predictable and focused on revenue growth.

Frequently Asked Questions


Spreadsheets hide geographical patterns in text rows. Pin mapping software converts raw addresses into visual, spatial intelligence, allowing teams to spot customer density, coverage gaps, and regional trends instantly.

Pin mapping software automatically geocodes address data exported from CRMs or spreadsheets. Uploading a simple .CSV or connecting Salesforce converts flat account lists into interactive, color-coded maps in seconds without writing code or requesting IT support.

Yes, pin maps expose overlapping sales representative paths and clustered accounts visually. By identifying account ownership conflicts, revenue teams can reassign accounts to nearby representatives, cutting travel time by 15–20%.

Event marketers can plot high-value customer accounts by revenue density on a pin map. Identifying central, high-density account clusters ensures venues are selected near the highest concentration of key stakeholders, maximizing attendance and event ROI.

Pin mapping layers existing facilities against demographic and customer density datasets. This exposes whitespace gaps, regions with high customer demand but zero physical presence, enabling confident, data-backed site selection.

No GIS training or coding is required. eSpatial is designed for business users, featuring drag-and-drop spreadsheet uploads and automated clustering that delivers actionable spatial insights in under five minutes.

eSpatial allows users to stack separate spreadsheets or Salesforce feeds as distinct layers on one map. Each layer can be styled independently, enabling teams to view customers, leads, and competitor sites side-by-side.

Pin mapping software drives ROI by cutting operational bloat and unlocking pipeline growth. Quantifiable metrics include reducing field travel costs by 15–20%, eliminating territory overlap conflicts, and targeting underserved high-value prospect clusters.

Business Intelligence (BI) maps render static status reports. Dedicated pin mapping software provides an interactive operational environment featuring dynamic pin clustering, custom field popup curation, direct Salesforce linking, territory balancing, and multi-stop route optimization.

Create Your Own Pin Map Today


You appear to be offline at the moment, this notice will disappear once your device can connect to the internet again