






|
The Insights Struggle |
The eSpatial Advantage |
|---|---|
|
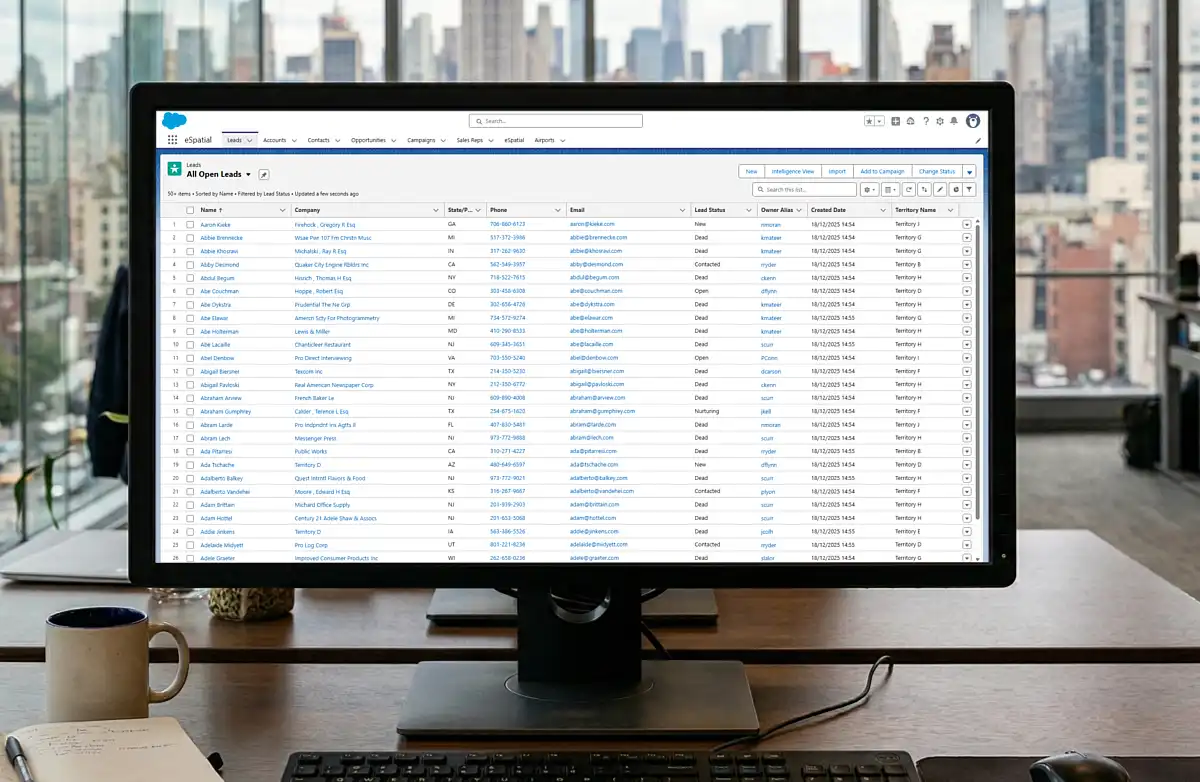
Linear BI: Staring at rows makes it impossible to see geographic overlaps or "white space" gaps. |
Geospatial Visualization: Patterns, clusters, and underserved markets become instantly visible via data visualization maps. |
|
Static Reporting: Hours spent cleaning data and manual "pin-dropping" in generic BI tools. |
Automated Insights: Upload .csv or sync Salesforce to generate an online mapping and visualization report in seconds, see how easy it is to get started with eSpatial. |
|
Subjective Decisions: "I think we have enough coverage in the Southeast". |
Objective ROI: "The geo visualization proves our 10-mile proximity rule covers 85% of target revenue". |
Our Customers Love Mapping With eSpatial
Visual Intelligence: Transforming
Big Data into Market Strategy

1. Complex Data Visualization
Standard business data visualization tools often crash or freeze when processing large datasets. eSpatial is engineered for enterprise-level scale, seamlessly handling millions of data points across your organization. Unlike standard mapping tools, it gives you the power to map up to 300,000 records on a single map without experiencing any lag.
2. Heat Map & Bubble Map Analysis
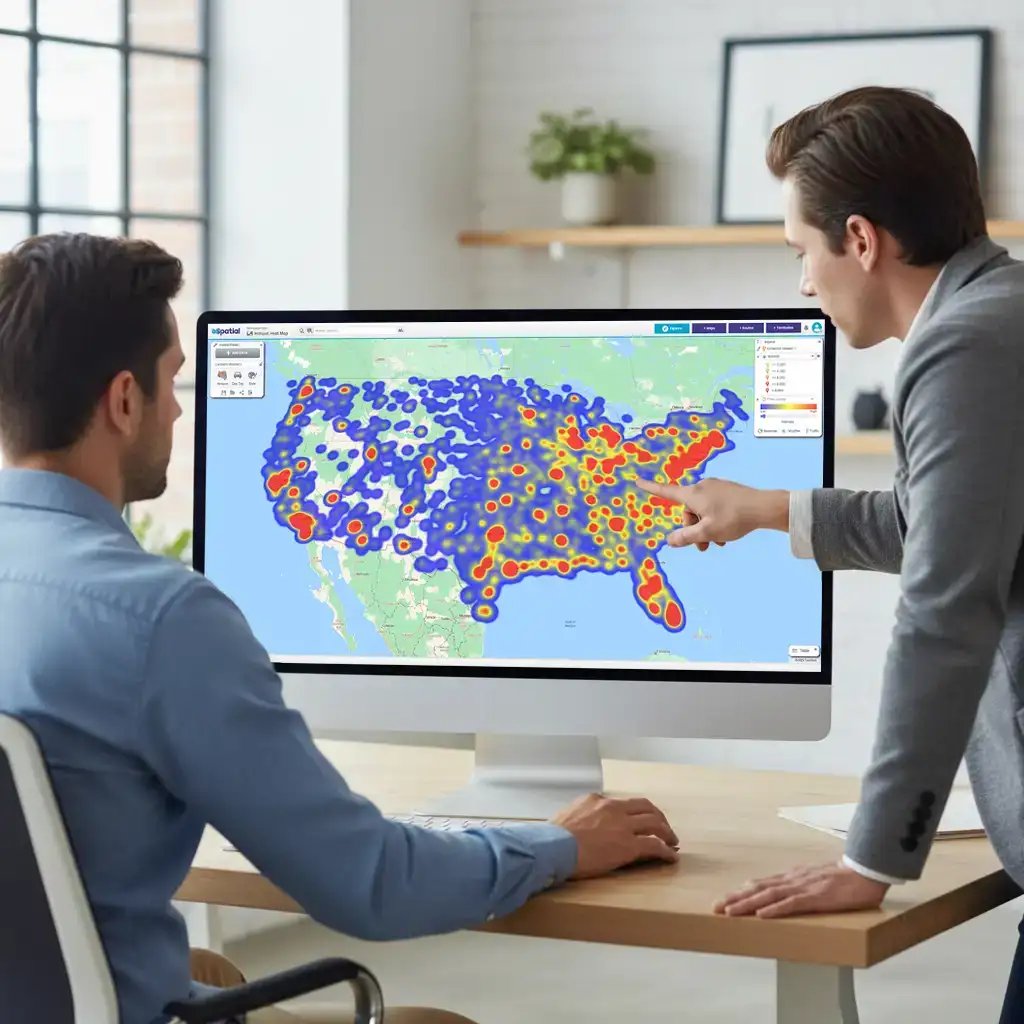
Identify your "Whales" using specialized types of map visualizations.
- Heat Maps: Ideal for geo visualization of market density or service gaps
- Bubble Maps: Scale pins by revenue or volume to highlight high-value targets geographically
3. Professional Visual Reporting with Maps
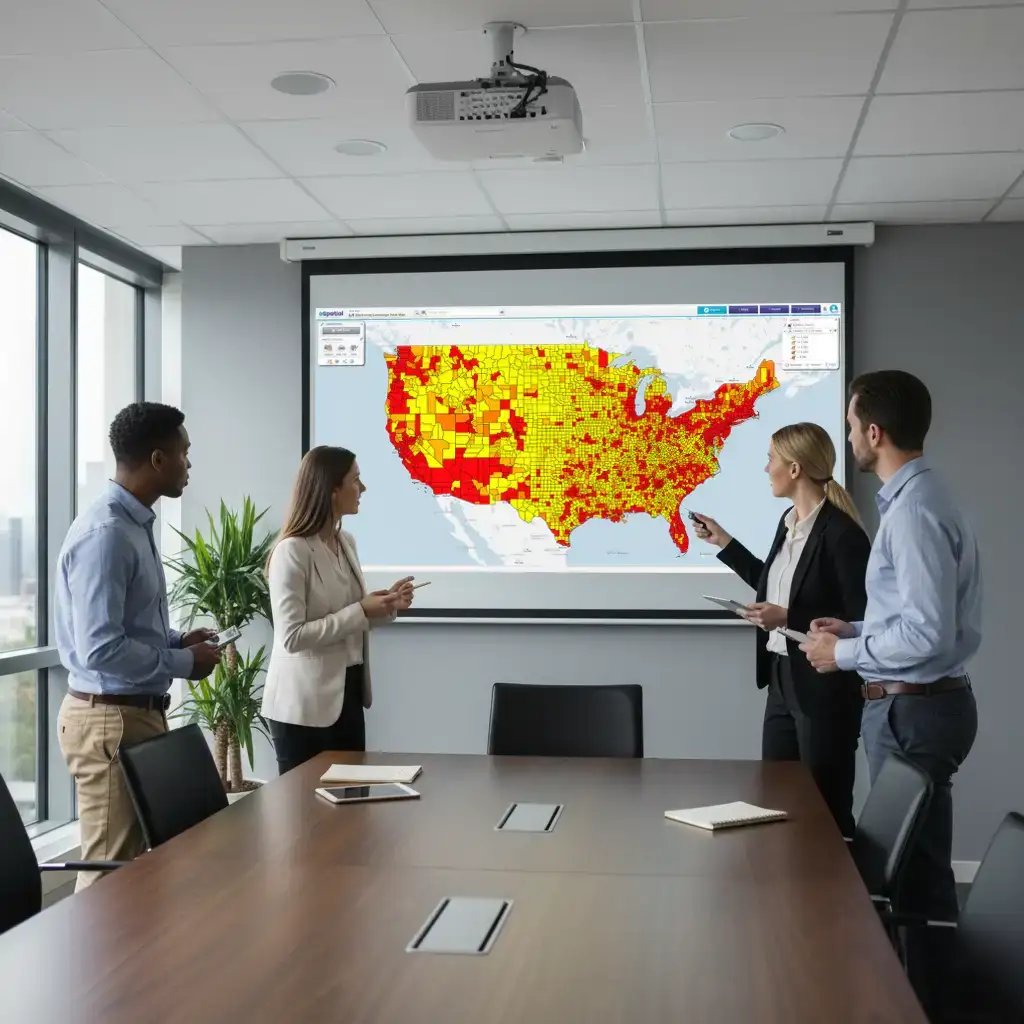
Go beyond the dashboard. Generate a visual report designed for boardrooms. Our spatial reporting tools allow you to customize branding, color palettes, and boundary labels, ensuring your geospatial visualization aligns with your corporate identity.
Industry Spotlight: Visualizing
Performance at Scale

Stop guessing where your next clinic belongs. Most healthcare leaders rely on spreadsheets that hide the truth about patient access . eSpatial turns that data into a clear story, allowing you to validate that 70% of employees are within a 10-mile radius of your care.
Whether you are identifying service gaps or presenting a winning Request for Proposal (RFP), we give you the visual proof needed to expand with confidence and close more business.

Turn days of reporting into 20 minutes of high-impact visualization. In the engineering and HVAC space, performance visibility is the difference between a market leader and a laggard.
eSpatial allows regional managers to see the performance of hundreds of offices at a glance, cutting annual reporting time by an entire month.
Whether you are identifying coverage gaps or presenting complex market trends to the president, our tools make your data "come alive," ensuring you spend less time in the office and more time on business strategy.

No more board presentations with spreadsheets. Start sparking real strategy. Community banks use eSpatial to transform dense financial data into visual insights that actually drive profitability.
By layering branch locations with demographic and customer analytics, leaders have created strategic maps to identify new branch opportunities and areas for consolidation.
It is time to ditch "dated" mapping for a fresh, professional output that wows executive management and turns numbers into actionable growth.

Unlock your next $1,000,000 in growth. When your safety or specialist teams double in size, legacy alignment tools just cannot keep up. Our clients use eSpatial to finalize sales territories right in front of stakeholders, cutting project delivery times from a year down to just four months.
This clarity allows you to unlock an additional 10% in sales potential and ensure your high-value reps are not wasting their day behind a windshield.

Build a service network that actually follows your fleet. In the automotive world, "close enough" is not good enough for your customers. Leaders use eSpatial to visualize every garage and driver location, allowing them to shift from expensive Original Equipment Manufacturer (OEM) repairs to high-quality local independents.
By seeing the "hidden map" of your network, you can increase local network usage to 70% and cut route planning time from 10 minutes to mere seconds.

Quit leaving money on the table at the job site. Your equipment is only valuable when it is in the right place at the right time. Our customers use eSpatial to bridge the gap between "gut feeling" and actual construction data, identifying $100,000’s in potential shipping savings by finding the most cost-effective plants.
Use these maps to challenge dealer perceptions, find gaps in your national coverage, and proactively target upcoming projects before the competition even knows they exist.
Trusted by Businesses Globally
★★★★★
eSpatial is Awesome
I have been using eSpatial for about a month and find it way more than I expected. Being able to easily utilize the system and visually seeing where incidents occur has helped us utilize resources more efficiently. The Customer Service is excellent.

★★★★☆
eSpatial is a great visual tool for mapping out leads, prospects, and current accounts
I appreciate the visual representation of all of the accounts and being able to connect the accounts with different filters and tools such as heat maps. It is a great organizational tool.
★★★★★
Great tool for creating custom maps and charts
This is a great tool for creating custom heat maps with our data. The CSV import makes it easy to upload and change data, and every point can show different markers. Very helpful for last minute presentations as well!

★★★★☆
Great tool for visualizing territories
We are able to send direct links to end users so they can visualize their areas of responsibility. Making changes to existing territories is very easy.
★★★★★
You must have no doubts, you must try
It is really very functional and effective for situations that require accurate data mapping. I like that I only have a little more than 20 days using it and I already feel like an expert. In addition, I love that I can establish effective data parameters to execute heat maps in a precise and personalized way.
★★★★★
Great Product!
This product is great and super easy to use. This has cut our route design timing in half. The customer service is fantastic!
★★★★★
The support is AMAZING and the tool is simple to use and works well!
The support is amazing. They reply right away every time! I have had two issues that needed resolution within an hour and their support team came through on both times.
★★★★★
Data Visualization Uncovers New Opportunities
The reason we selected and continuously renew our account is the outstanding support we receive each step of the way. eSpatial invests in your success and wants you to be getting the most out of their platform.
★★★★★
eSpatial is a lifesaver!
I have had nothing but success with eSpatial. When previous products were limited in their abilities (map sharing, dynamic maps, etc.).
★★★★☆
Engel & Völkers Americas
At E&V we use this software as a sales tool to show prospects their "territory" first hand. We also are able to create maps using address points to make it easier for our sales team to navigate larger areas of the US to make better use of their time.
★★★☆☆
Easy to use limited in customization
How easy the program is to learn. Easy to import new data.
★★★★☆
Great tool to help our non-profit plan
We appreciate the ability to layer multiple variables at a time.
★★★★★
User Friendly Mapping
I love how easy it was to learn how to map on this software. The set-up was not difficult either and they had a representative reach out personally to help you with your account whether you wanted a phone call or email help.
★★★★★
Great Collaborative platform!
I run a small team that responds to inbound leads with the purpose of qualifying and setting up meetings for our Sales partners. With the higher volume and tight turnaround times we deal with, a collaborative plugin like eSpatial is invaluable.
★★★★★
Bulletproof - Program And People
The program works flawlessly. It's so easy to add data, change the view, isolate territories - total flexibility.
★★★★☆
Excellent Data Visualisation
Ability to customise heat maps and overlay multiple data sets.
★★★★★
Fantastic product and service
This system provides a tremendous insight into our trading locations to allow us to make dynamic decisions. The team and after sales care are in keeping with the systems quality.
★★★★☆
Great program that's simple to use
eSpatial is very user-friendly, allowing us to spend little time implementing and training how to use the software. When we had issues, their excellent customer service was quick to respond.
★★★★★
Most User Friendly Mapping Tool & White Glove Customer Service!
Constant tool enhancements, extremely helpful & quick customer support, user friendly / great UI, easy to upload data, territory balancing option quick to learn / no implementation needed.
★★★★★
eSpatial is Awesome
I have been using eSpatial for about a month and find it way more than I expected. Being able to easily utilize the system and visually seeing where incidents occur has helped us utilize resources more efficiently. The Customer Service is excellent.
★★★★☆
eSpatial is a great visual tool for mapping out leads, prospects, and current accounts
I appreciate the visual representation of all of the accounts and being able to connect the accounts with different filters and tools such as heat maps. It is a great organizational tool.
★★★★★
Great tool for creating custom maps and charts
This is a great tool for creating custom heat maps with our data. The CSV import makes it easy to upload and change data, and every point can show different markers. Very helpful for last minute presentations as well!
★★★★☆
Great tool for visualizing territories
We are able to send direct links to end users so they can visualize their areas of responsibility. Making changes to existing territories is very easy.
★★★★★
You must have no doubts, you must try
It is really very functional and effective for situations that require accurate data mapping. I love that I can establish effective data parameters to execute heat maps in a precise and personalized way.
★★★★★
Great Product!
This product is great and super easy to use. This has cut our route design timing in half. The customer service is fantastic!
★★★★★
The support is AMAZING and the tool is simple to use and works well!
The support is amazing. They reply right away every time! I have had two issues that needed resolution within an hour and their support team came through on both times.
★★★★★
Data Visualization Uncovers New Opportunities
The reason we selected and continuously renew our account is the outstanding support we receive each step of the way. eSpatial invests in your success and wants you to be getting the most out of their platform.
★★★★★
eSpatial is a lifesaver!
eSpatial has set out to crush it from day one. Any improvement that I've suggested has eventually been implemented, and the customer service/support is TOP NOTCH.
★★★★☆
Engel & Völkers Americas
At E&V we use this software as a sales tool to show prospects their "territory" first hand. We also are able to create maps using address points to make it easier for our sales team to navigate larger areas of the US to make better use of their time.
★★★☆☆
Easy to use limited in customization
How easy the program is to learn. Easy to import new data.
★★★★☆
Great tool to help our non-profit plan
We appreciate the ability to layer multiple variables at a time.
★★★★★
User Friendly Mapping
I love how easy it was to learn how to map on this software. The set-up was not difficult either and they had a representative reach out personally to help you with your account whether you wanted a phone call or email help.
★★★★★
Great Collaborative platform!
I run a small team that responds to inbound leads with the purpose of qualifying and setting up meetings for our Sales partners. With the higher volume and tight turnaround times we deal with, a collaborative plugin like eSpatial is invaluable.
★★★★★
Bulletproof - Program And People
The program works flawlessly. It's so easy to add data, change the view, isolate territories - total flexibility.
★★★★☆
Excellent Data Visualisation
Ability to customise heat maps and overlay multiple data sets.
★★★★★
Fantastic product and service
This system provides a tremendous insight into our trading locations to allow us to make dynamic decisions. The team and after sales care are in keeping with the systems quality.
★★★★☆
Great program that's simple to use
eSpatial is very user-friendly, allowing us to spend little time implementing and training how to use the software. When we had issues, their excellent customer service was quick to respond.
★★★★★
Most User Friendly Mapping Tool & White Glove Customer Service!
Constant tool enhancements, extremely helpful & quick customer support, user friendly / great UI, easy to upload data, territory balancing option quick to learn / no implementation needed.
★★★★★
eSpatial is a very easy to use mapping tool for various business needs
Easy to upload data and format maps. Heat maps give us a quick view of our business and the radius and filters help us make business decisions.
★★★★★
eSpatial has been a great partner and their platform helps us in many aspects of sales planning
A great onboarding/training program helps hit the ground running. The dedicated success team is quick to respond, takes feedback, and continues to check in on our needs.
★★★★★
eSpatial is easy to use, maps are visually appealing, and the customer support is fantastic
Any time I have had a question or concern, the support team has responded very quickly and addressed all of my needs with the software.
★★★★☆
Great integration options & helpful support team
The ability to route at a postal code level and layer it among other data.
★★★★★
Wonderful application!
The ease of use and system functionality allow you to generate customized maps.
★★★★☆
Easy to use mapping and territory creator for logistics company
eSpatial is extremely easy to use when it comes to creating maps or territories. We utilize this to keep up with and modify the areas in which we service our customers.
★★★★★
Very Easy and Intuitive
I like the ability to be able to easily plan my routes for my sales calls. It helps me make the most of the time I have and the miles I drive, and allows me to hit my goals more easily than if I were just flying by the seat of my pants.
★★★★★
Great Customer Support
The customer support is fantastic. I wish that every company serviced their customers like eSpatial.
★★★★★
Advancing Your Business Development and Growth
I like best about eSpatial is the ease of the tool and support from the eSpatial team.
★★★☆☆
Use eSpatial for simple policy mapping
Updates to maps in my eSpatial account automatically sync to the webpages where I have them linked.
★★★★★
Mapping
The ability to slice a data set into different maps and share them with non-licensed users.
★★★★☆
Good Mapping System for Corporate Customers
I like the user interface and how you can manipulate the layers and appearances of the maps.
★★★★★
Great Out of The Box UI and Fantastic Customer Support
Easy to map and design territories; clean UI.
★★★★★
Great product
Excellent reaction time, accuracy, customer service.
★★★★★
eSpatial Was Definitely the Right Choice for my Company
User-friendly, powerful, visually attractive, accurate, with robust data integration.
★★★★★
Amazing Product. Otherwordly Support
I use eSpatial to plot sales by zip codes for retailers and their competitors. The mapping helps me to better focus digital advertising, decide y/n on cable zones, and to measure effectiveness of changes in media plans. Clients love it, because . . . well, the map has life. A spreadsheet does not.
★★★★☆
There was a change in the website design but I preferred the old one
Something that is good about eSpatial is for planning proximity purposes, it is a good tool.
★★★★★
A Great Tool for Mapping Customers and for Marketing
The ease of use. The platform makes uploading data and mapping extremely easy. This is not limited to just customer data.
★★★★★
Strategic Mapping of College Sports Fans
Visualizing the data through heat maps or radius maps allows me to tell a positive story that is easy to comprehend.
★★★★★
eSpatial is a very easy to use mapping tool for various business needs
Easy to upload data and format maps. Heat maps give us a quick view of our business and the radius and filters help us make business decisions.
★★★★★
eSpatial has been a great partner and their platform helps us in many aspects of sales planning
A great onboarding/training program helps hit the ground running. The dedicated success team is quick to respond, takes feedback, and continues to check in on our needs.
★★★★★
eSpatial is easy to use, maps are visually appealing, and the customer support is fantastic
Any time I have had a question or concern, the support team has responded very quickly and addressed all of my needs with the software.
★★★★☆
Great integration options & helpful support team
The ability to route at a postal code level and layer it among other data.
★★★★★
Wonderful application!
The ease of use and system functionality allow you to generate customized maps.
★★★★☆
Easy to use mapping and territory creator for logistics company
eSpatial is extremely easy to use when it comes to creating maps or territories. We utilize this to keep up with and modify the areas in which we service our customers.
★★★★★
Very Easy and Intuitive
I like the ability to be able to easily plan my routes for my sales calls. It helps me make the most of the time I have and the miles I drive, and allows me to hit my goals more easily than if I were just flying by the seat of my pants.
★★★★★
Great Customer Support
They ask the right questions to get an understanding of what you need to accomplish with the software. Their overall knowledge of the practical way to use the software of the software is phenomenal.
★★★★★
Advancing Your Business Development and Growth
I like best about eSpatial is the ease of the tool and support from the eSpatial team.
★★★☆☆
Use eSpatial for simple policy mapping
Updates to maps in my eSpatial account automatically sync to the webpages where I have them linked.
★★★★★
Mapping
The ability to slice a data set into different maps and share them with non-licensed users.
★★★★☆
Good Mapping System for Corporate Customers
I like the user interface and how you can manipulate the layers and appearances of the maps.
★★★★★
Great Out of The Box UI and Fantastic Customer Support
Easy to map and design territories; clean UI.
★★★★★
Great product
Excellent reaction time, accuracy, customer service.
★★★★★
eSpatial Was Definitely the Right Choice for my Company
User-friendly, powerful, visually attractive, accurate, with robust data integration.
★★★★★
Amazing Product. Otherwordly Support
I use eSpatial to plot sales by zip codes for retailers and their competitors. The mapping helps me to better focus digital advertising, decide y/n on cable zones, and to measure effectiveness of changes in media plans. Clients love it, because . . . well, the map has life. A spreadsheet does not.
★★★★☆
There was a change in the website design but I preferred the old one
Something that is good about eSpatial is for planning proximity purposes, it is a good tool.
★★★★★
A Great Tool for Mapping Customers and for Marketing
The ease of use. The platform makes uploading data and mapping extremely easy. This is not limited to just customer data.
★★★★★
Strategic Mapping of College Sports Fans
Visualizing the data through heat maps or radius maps allows me to tell a positive story that is easy to comprehend.
Mapping Software Solutions
-
 Market Analysis & Trends
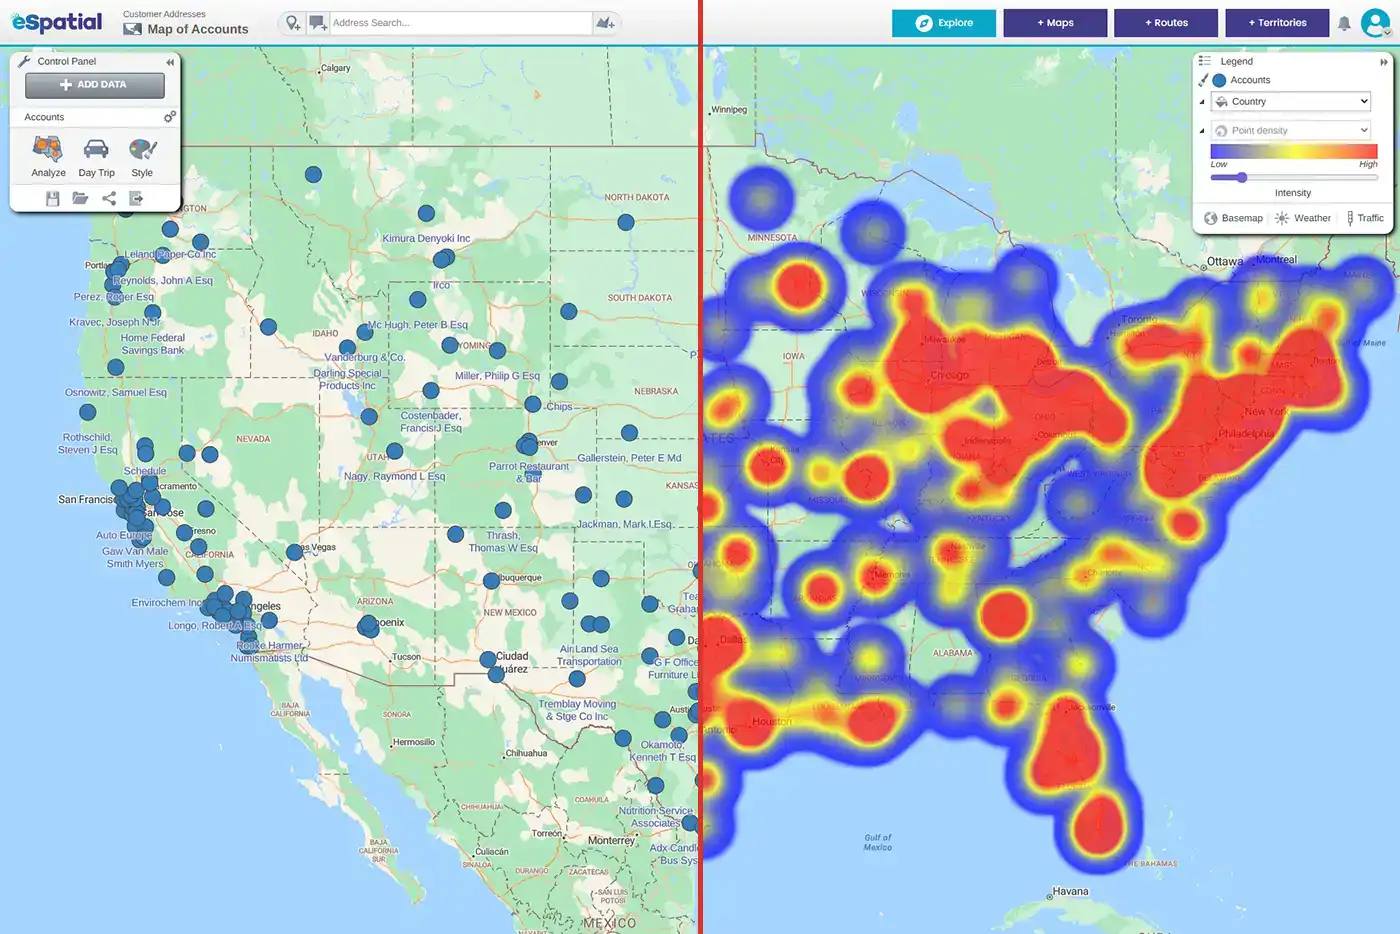
Find your white space. Use heat maps and spatial analysis to spot regional gaps, untapped potential, and de-risk expansion.
-
 Strategic Location Decisions
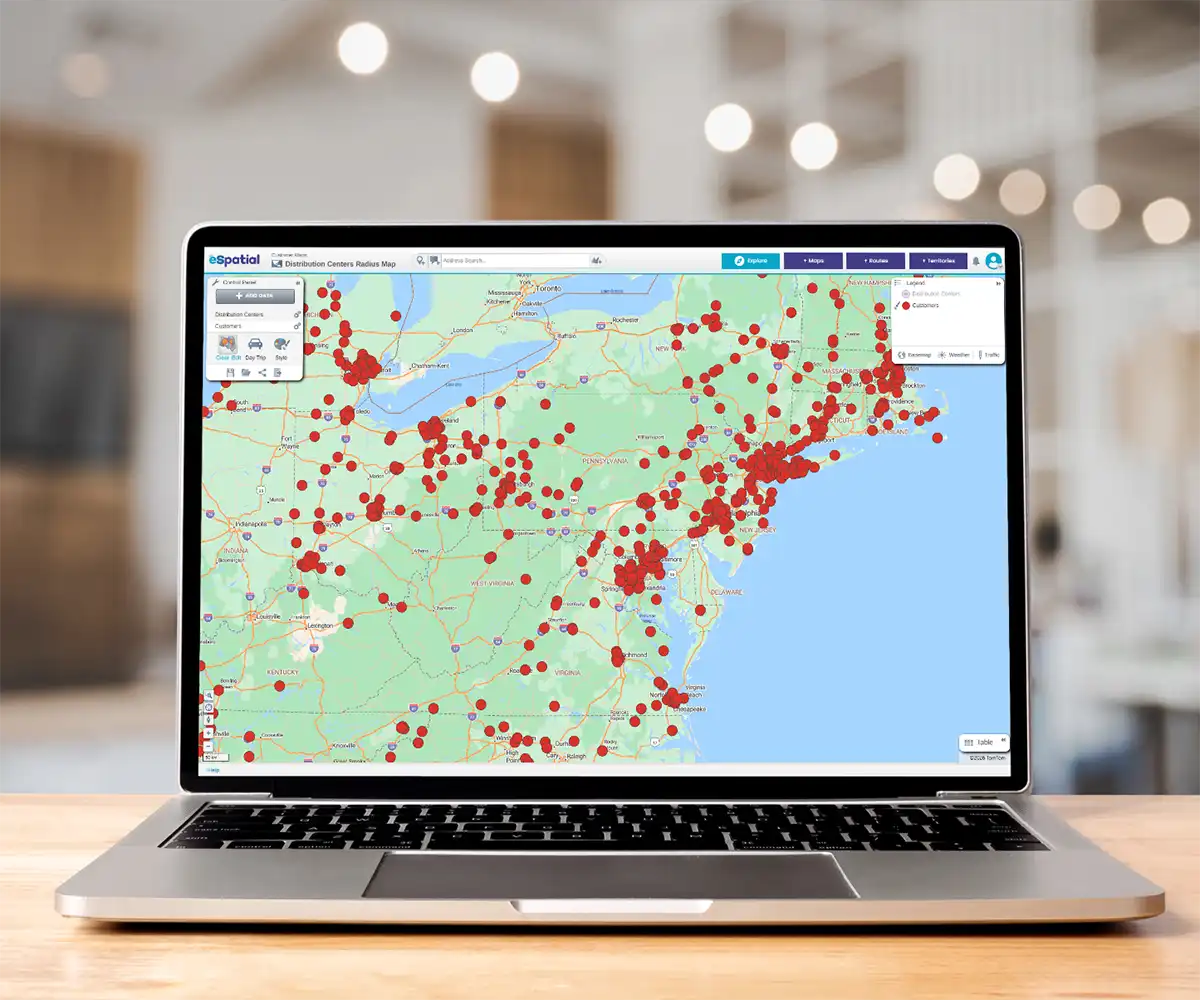
Align physical assets with demand. Map workforce locations securely, optimize site selection, and mitigate risk with proximity analysis.
-
 Sales Productivity
Give reps back 5 hours a week. Natively map your CRM data to visually cluster high-value accounts and analyze your sales pipeline.