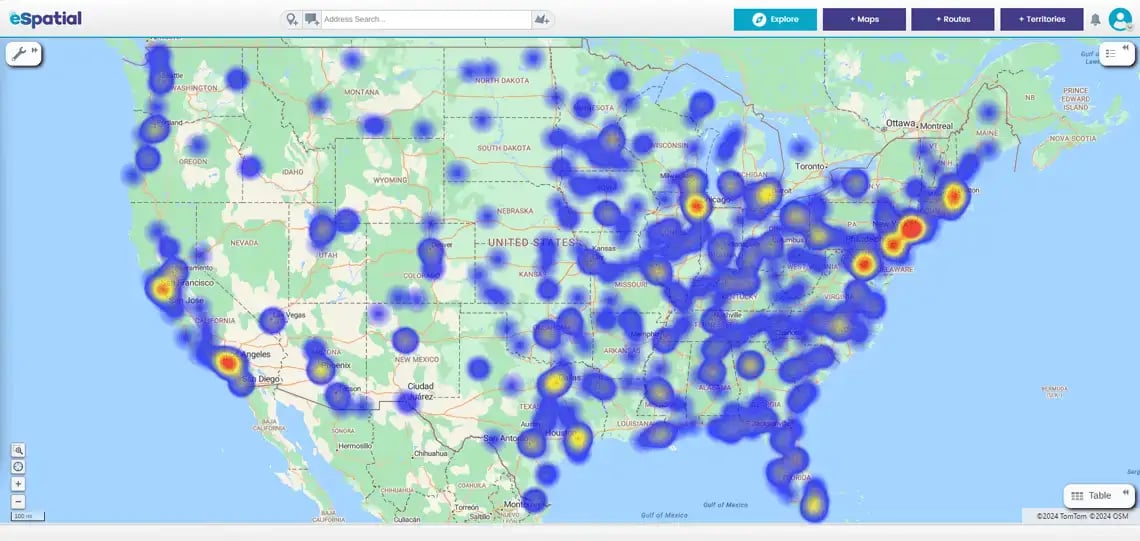
It is a visual tool that uses color intensity to represent data density on a map.
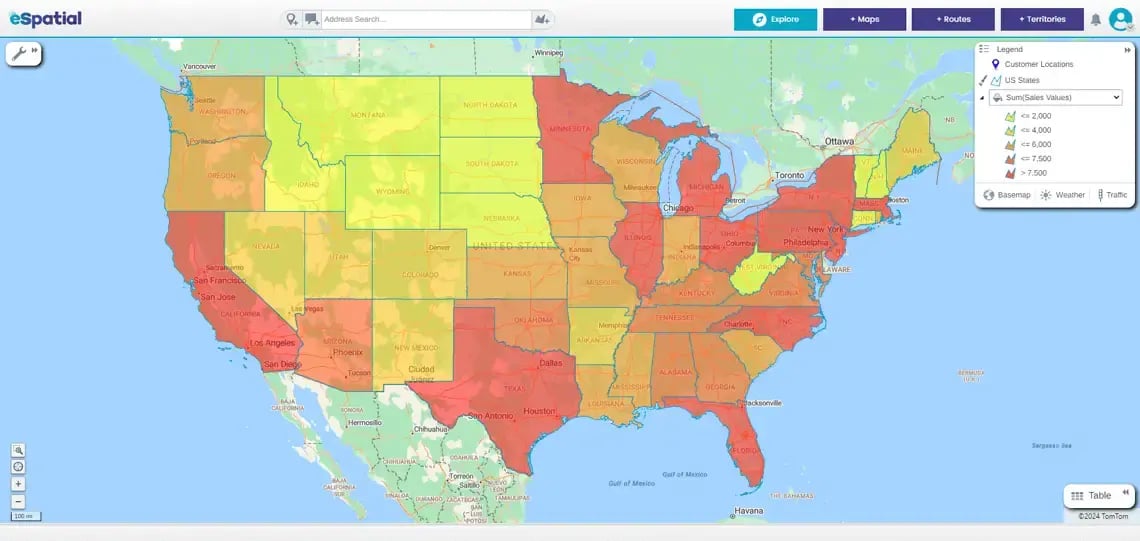
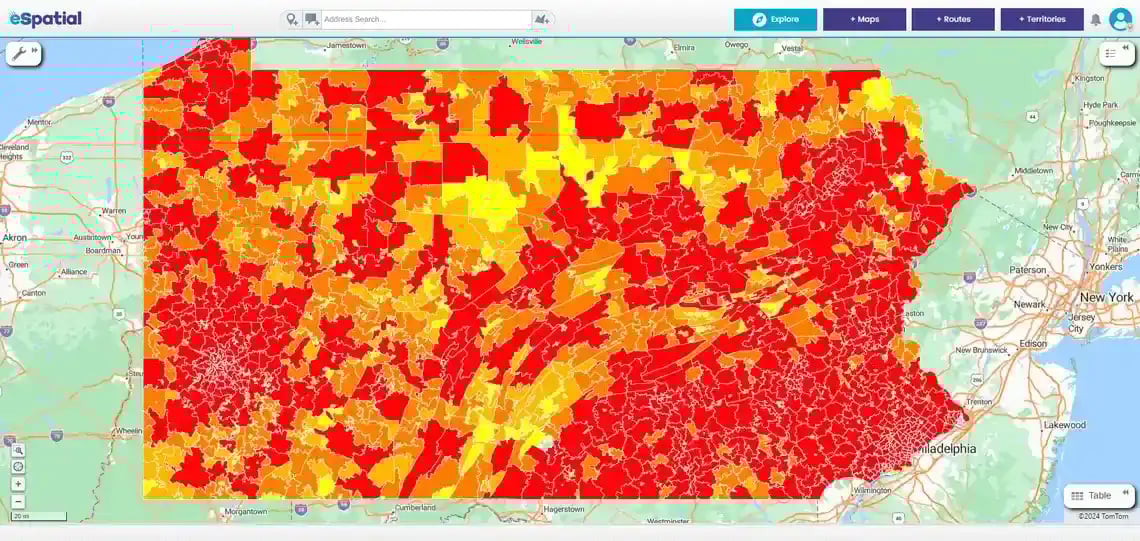
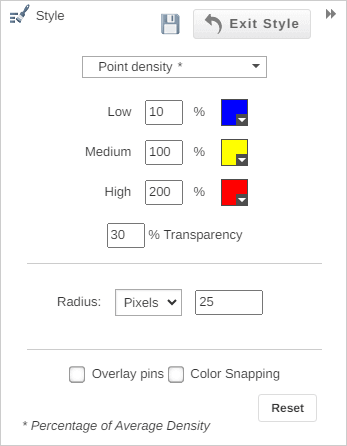
How it works: Turn raw data into a clear, colour-coded map. We paint your data from "cool" (low activity) to "hot" (high intensity) so you see exactly what is happening.
You stop scanning spreadsheets and start spotting patterns, trends and concentrations in milliseconds.