



4.8/5 of 53 reviews
4.3/5 of 38 reviews

The Sales Leader’s Guide
to Mapping Software: Unlocking Growth, Balancing Territories and Driving Field Productivity


Eliminate territory blind spots, optimize field productivity, and drive data-backed growth across your entire organization.

Customer list in a spreadsheet
Territory map of USA

The Visual Intelligence Void Beyond the AI Stack & CRM Dashboards


Customer list on a spreadsheet
Optimising territories in eSpatial

Modern sales organizations do not lack analytical technology. Commercial leaders operate sophisticated tech stacks, tracking pipeline metrics in Salesforce, scoring buyer intent with AI engines, analyzing deal conversations in Gong, and building executive dashboards in Power BI.

Yet, despite this technical investment, a critical structural blind spot remains: data processing power and AI text generation are not the same as visual spatial intelligence.

Standard CRMs and BI platforms present data in flat rows, columns, and static charts. Generative AI summarizes text and predicts lead scores. But when sales leaders need to solve physical, real-world execution problems like:

  • Where is our actual account density clustering relative to rep home bases?
  • Which high-potential sales corridors are being neglected due to travel drag?
  • Where are competitors encroaching on core accounts?
  • Are our territory boundaries creating unfair workloads that drive rep turnover?

Abstract tables and dashboards force leadership into heavy mental analysis.

Maps leverage natural human spatial reasoning to transform raw CRM data into an interactive visual reference. A map communicates a data story that no spreadsheet, static chart, or text prompt can replicate. It translates abstract revenue metrics into physical clarity, allowing sales leaders to instantly spot hidden growth corridors, eliminate windshield time, and justify strategy to the C-suite.

Capability Dimension

Standard CRM, BI & AI Stack

Visual Location Intelligence Engine

Data Representation

Abstract Records: Isolated tables, pipeline charts, and numeric widgets.

Map: Customer accounts, rep locations, drive times, and pipeline layers merged into a single interactive map.

Cognitive Effort

High Mental Load: Requires manual mental translation to figure out where numerical data physically exists.

Instant Recognition: Account clusters, geographic dead zones, and territory overlaps pop off the screen immediately.

Territory Equity

Single-Metric Focus: Balances solely on account count or past revenue, ignoring physical travel reality.

Multi-Variable Workload Index: Balances account density, pipeline value, call frequency, and actual drive times simultaneously.

Stakeholder Consensus

Static Disputes: Endless spreadsheet arguments over zip code lists, commission impacts, and boundary shifts.

Interactive Alignment: Live "what-if" scenario modeling on shared screens, securing immediate buy-in from managers.

AI First Vs. Visual Spatial Infrastructure Why AI Needs a Visual Mapping Foundation


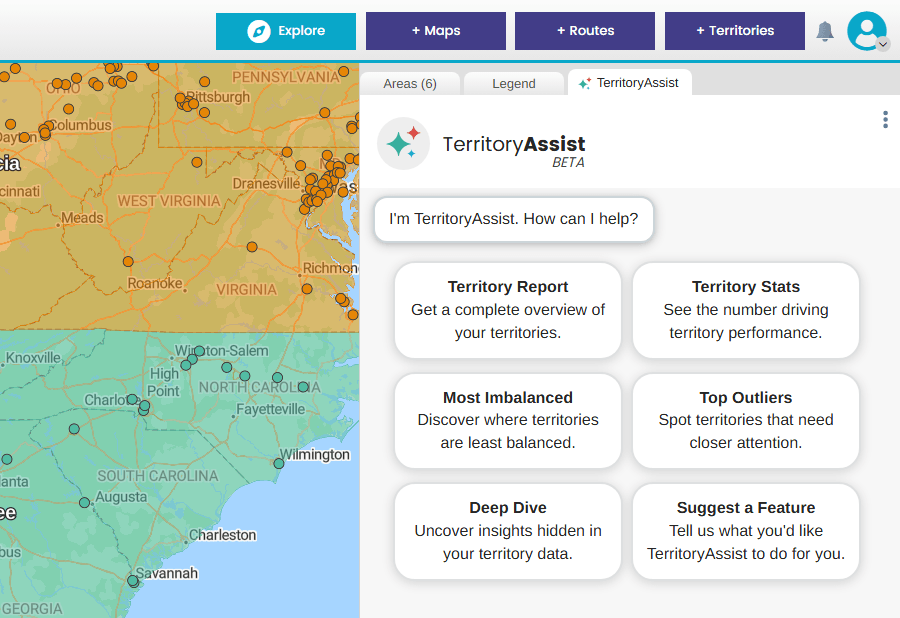
Person using TerritoryAssist
TerritoryAssist chips

The prevailing narrative in sales technology is dominated by "AI-first" platforms. This is why eSpatial introduced an AI Territory Assistant. AI is a transformational tool for automating outreach, predicting conversion likelihood, and drafting communications.

However, AI cannot draw or evaluate a physical sales infrastructure. An algorithm can flag an account as "high intent", but it cannot visually show a sales leader whether that account sits in a rep's natural travel corridor or across an impassable geographic boundary. It cannot visually model how shifting three ZIP codes affects a rep's weekly windshield time versus their face-to-face selling capacity.

Predictive AI operates best when applied to a sound, visually optimized geographic territory framework (Like Territory Assistant). Without location intelligence to structure rep hierarchies, territory shapes, and travel networks, AI lead routing simply accelerates sales friction by sending high-value leads to reps who lack the physical capacity to cover them.

The 20% Territory Realignment Mandate:
Managing Real-World Territory Volatility


A fundamental reality facing sales leadership is that at any given time, approximately 20% of sales territories are out of balance. Territories are not static boundaries designed once a year during fiscal planning; they are dynamic operational frameworks subject to constant real-world decay. This 20% drift is caused by predictable operational factors:

The Cost of Inaction: Spreadsheets
vs. Dedicated Territory Software


According to research from the Sales Management Association (SMA), 78% of sales organizations actively avoid regular territory realignments due to dread of internal friction, complex spreadsheet modeling, and disruption to customer relationships. However, relying on static spreadsheets to manage dynamic territories creates a severe revenue deficit:

Company Revenue
Target Attainment

Dedicated Territory Software: 86%
Spreadsheet Users: 46%

Individual Rep
Quota Attainment

Dedicated Territory Software: 68%
Spreadsheet Users: 52%

Furthermore, while 83% of sales leaders state that balancing workload is critical, only 44% can execute it effectively using spreadsheets. When territories remain out of balance, top performers are burned out by travel drag while under-allocated reps miss quota due to lack of opportunity.

Core Sales Use Cases,
ROI & Map Matrix


To drive commercial execution, sales leaders utilize specific map types to solve distinct operational challenges.

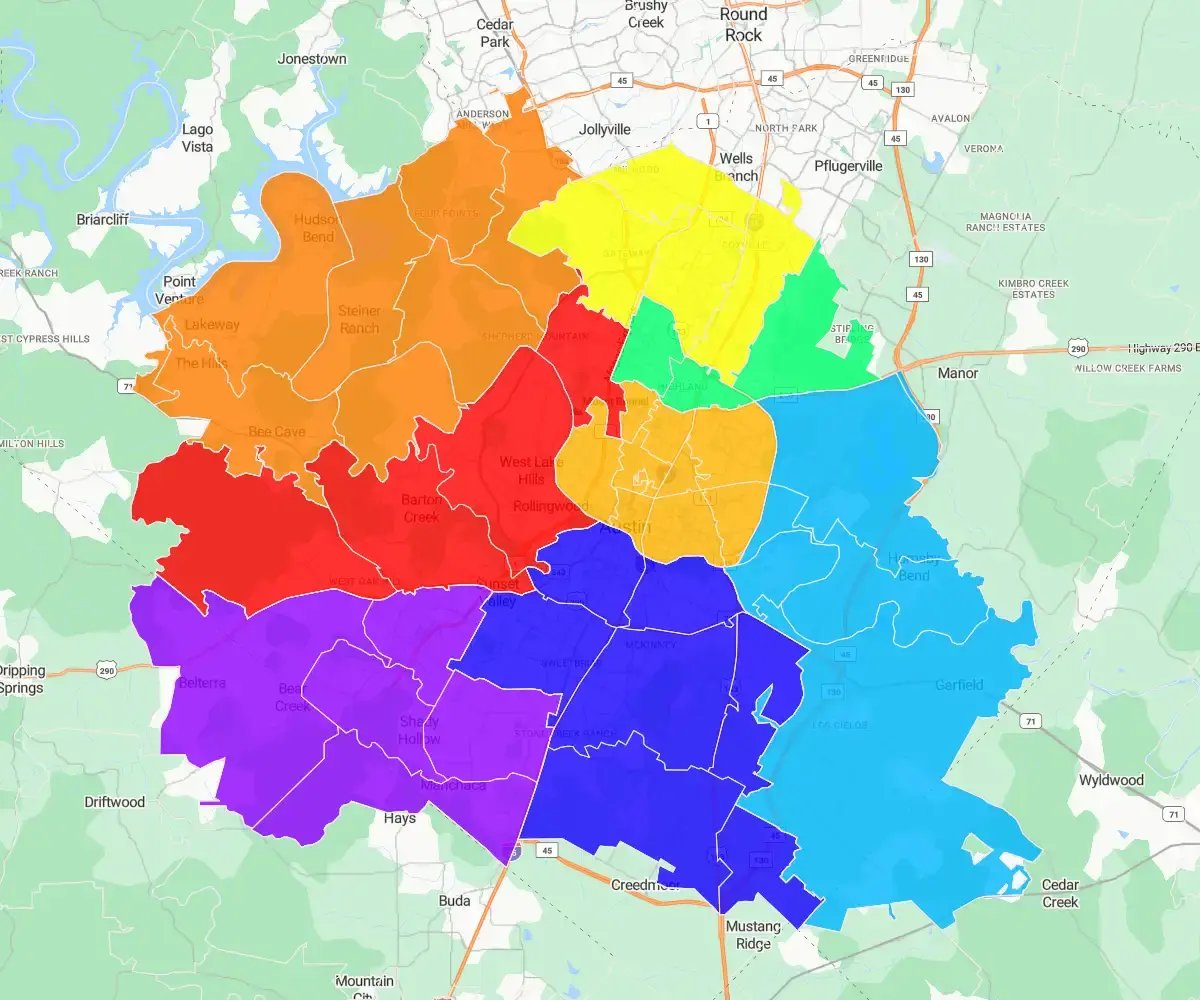
Territory map of Austin, Texas

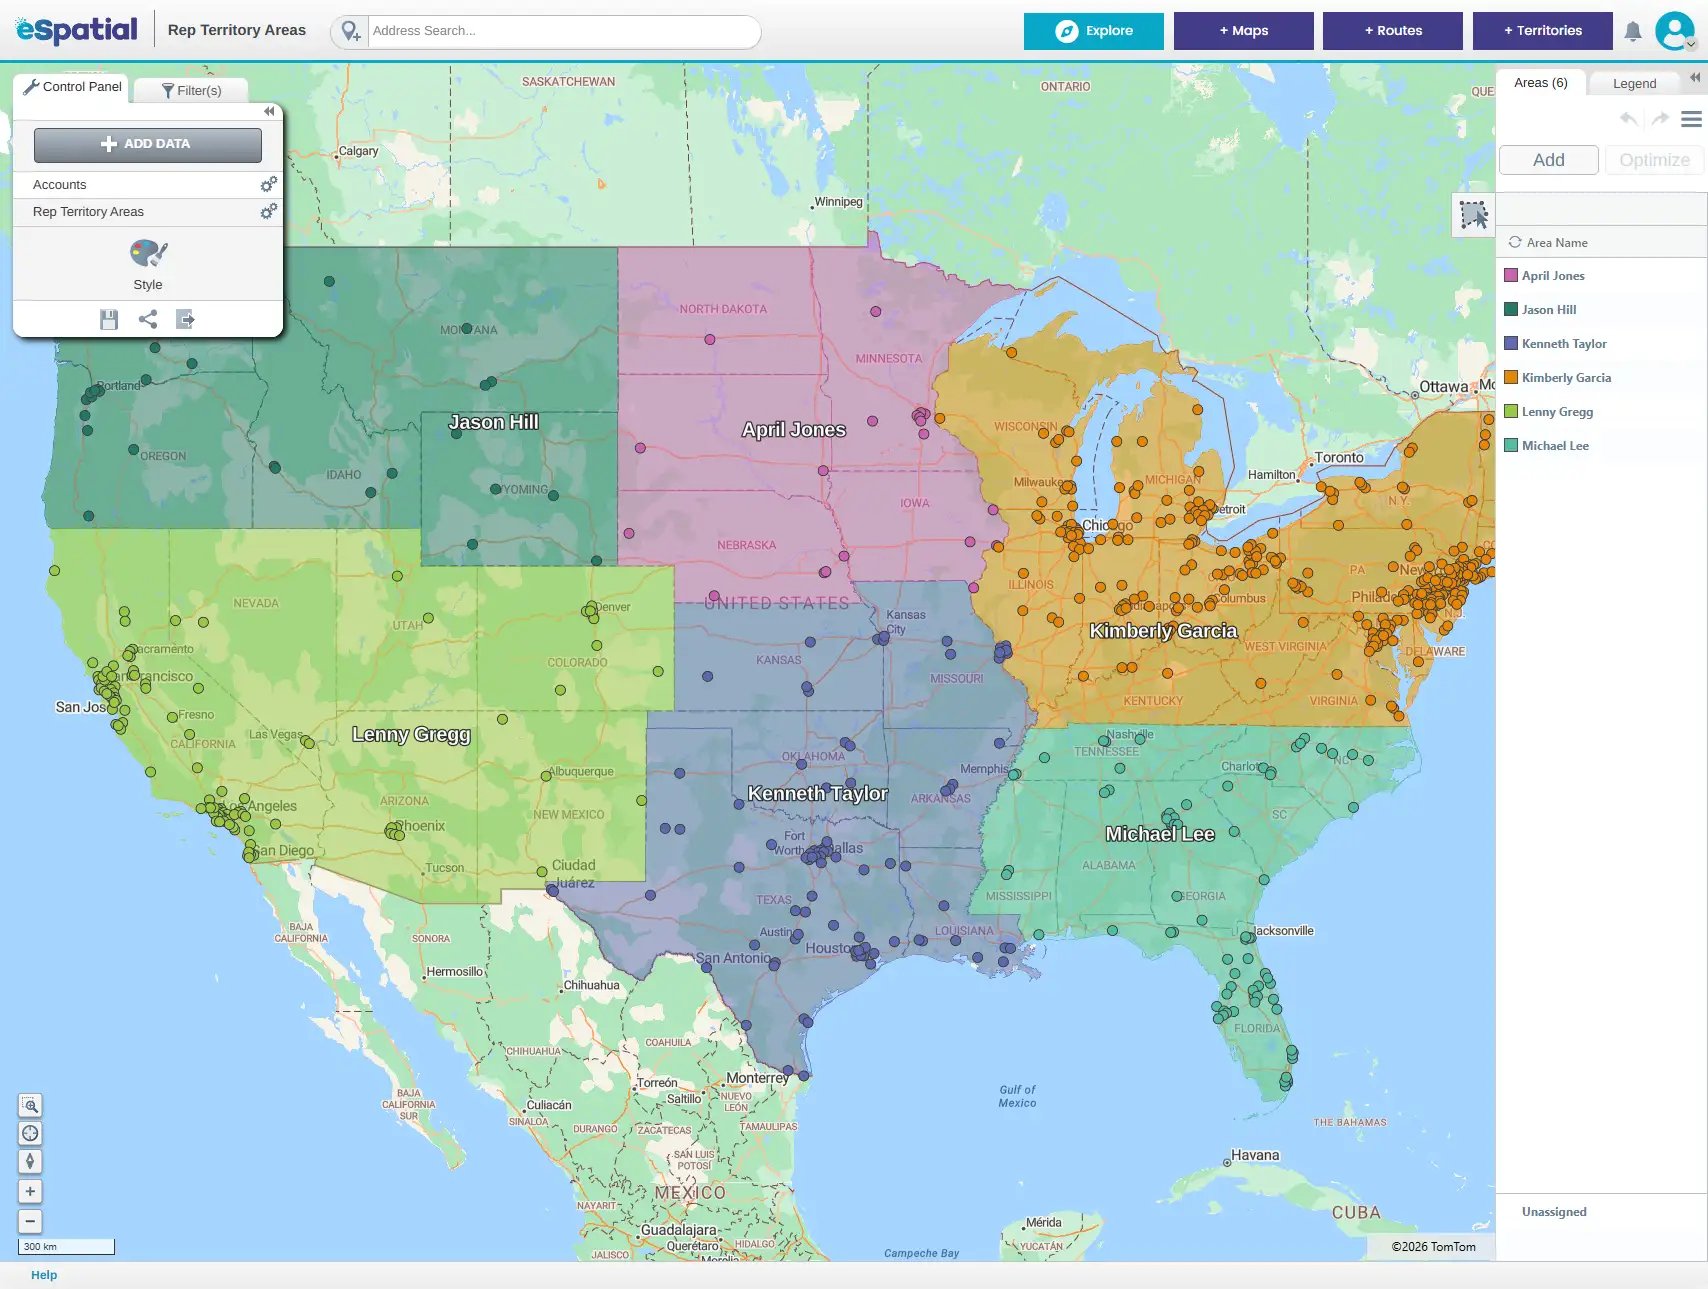
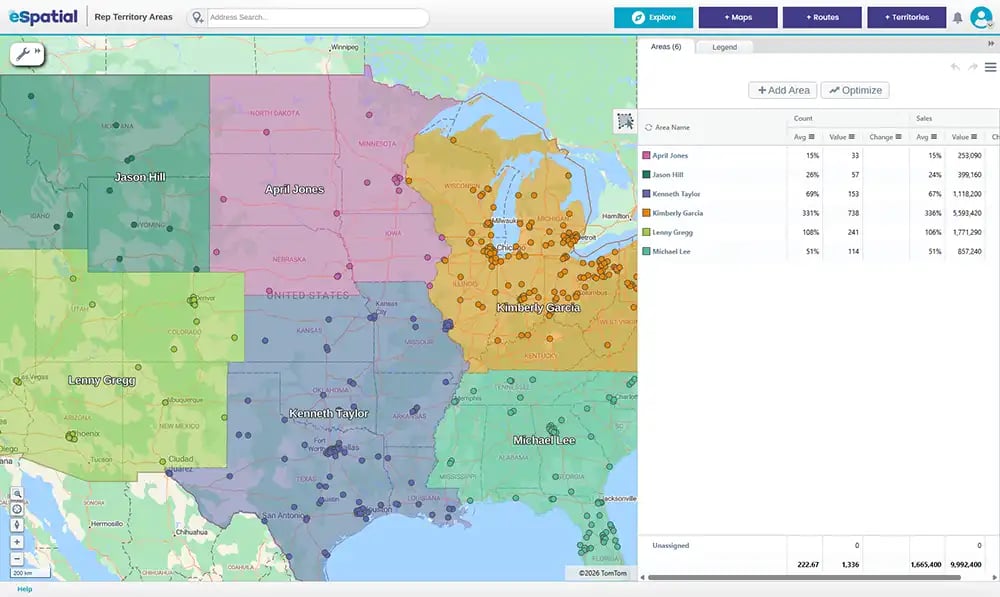
Territory Boundary Maps

Core Capability

Polygon boundary layers mapped to zip codes, counties, or DMAs.

Primary Sales Leadership Use Case

Designing non-overlapping territories and running live "what-if" rebalancing scenarios.

Commercial Impact & ROI Metric

Slashes realignment cycles from weeks down to hours. Captures a 2% to 7% revenue expansion through market coverage.

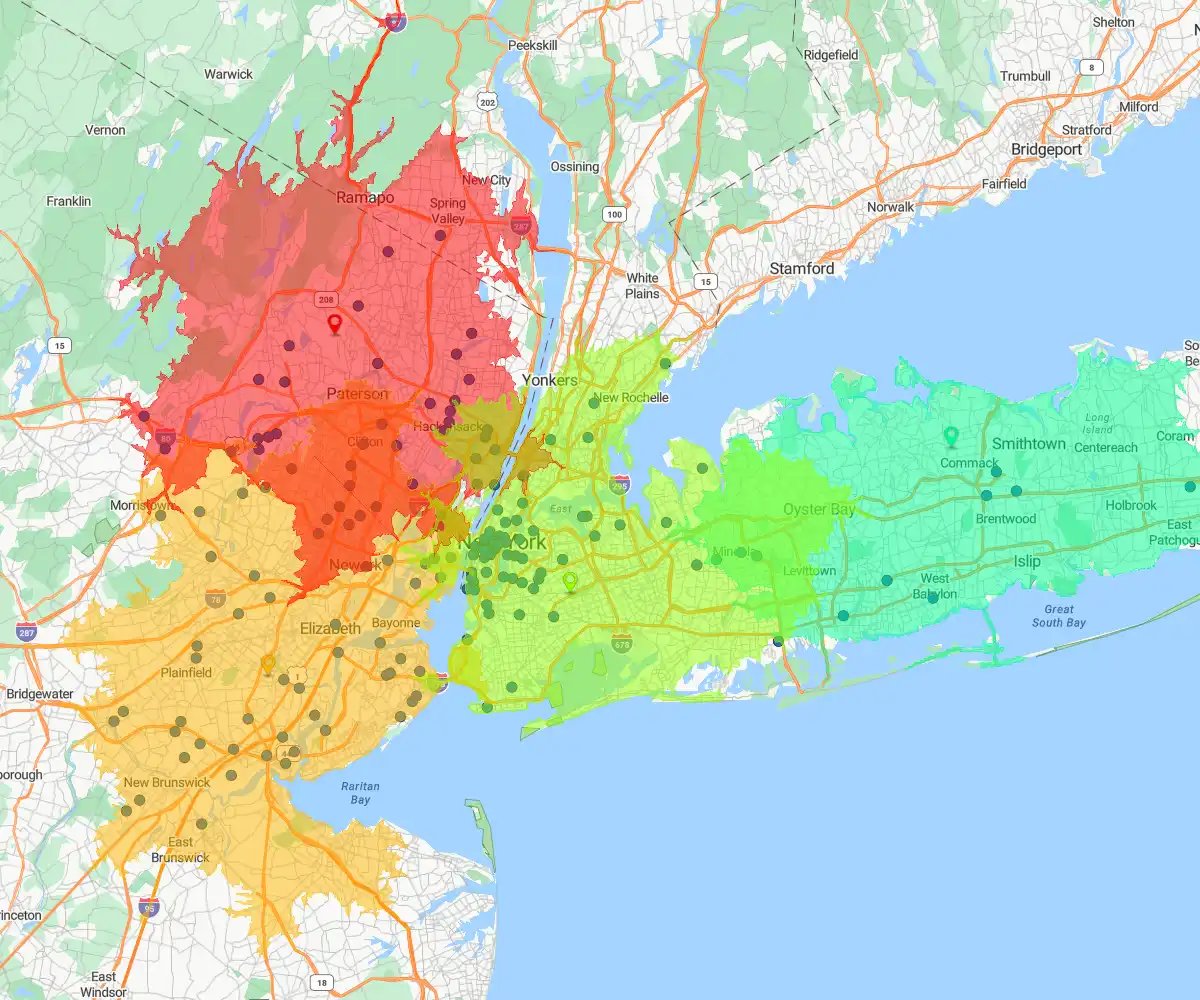
Drive-time map, New York

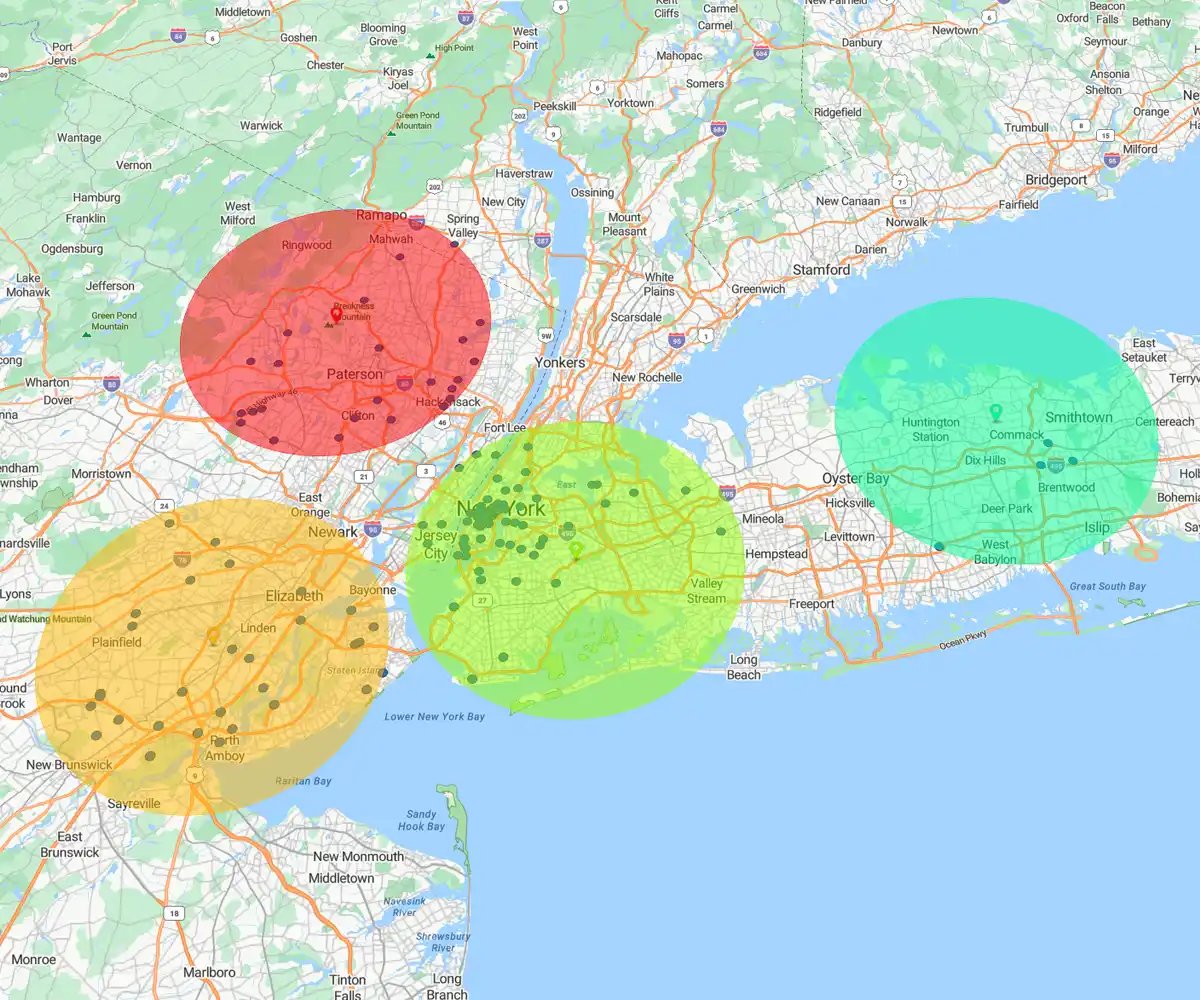
Drive-Time (Isochrone) Maps

Core Capability

Polygon buffers calculated using actual road networks and traffic, not flat radii.

Primary Sales Leadership Use Case

Multi-stop trip optimization, field capacity planning, and rep travel analysis.

Commercial Impact & ROI Metric

Reclaims up to 30% in field selling time and reduces fuel spend.

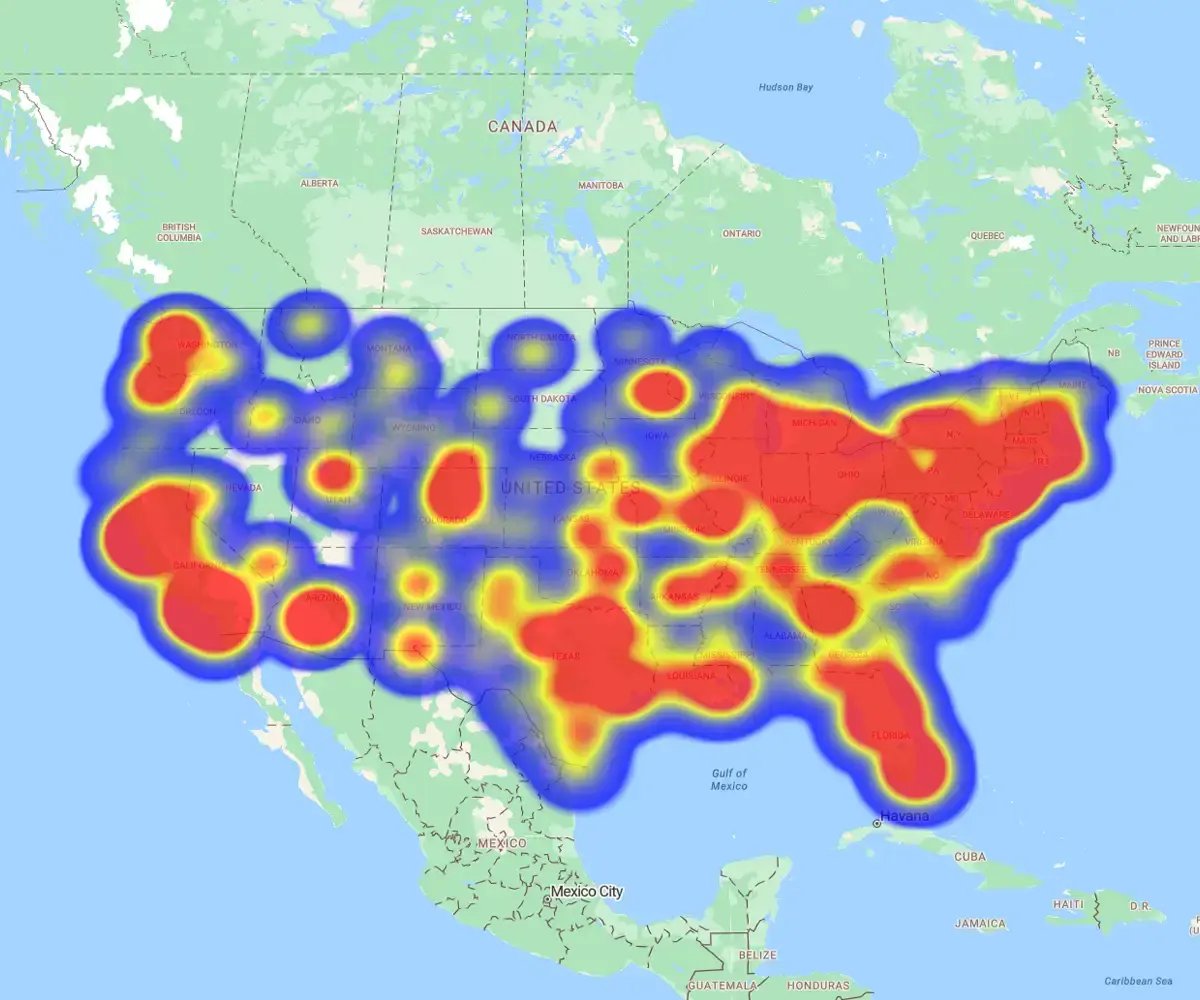
Hotspot heat map, USA

Hotspot Heatmaps

Core Capability

Density modeling showing account and prospect concentration gradients.

Primary Sales Leadership Use Case

Spotting underserved markets, evaluating whitespace, and planning regional campaigns.

Commercial Impact & ROI Metric

Turns data into actionable insights beyond what spreadsheet can offer.

Radius map, New York

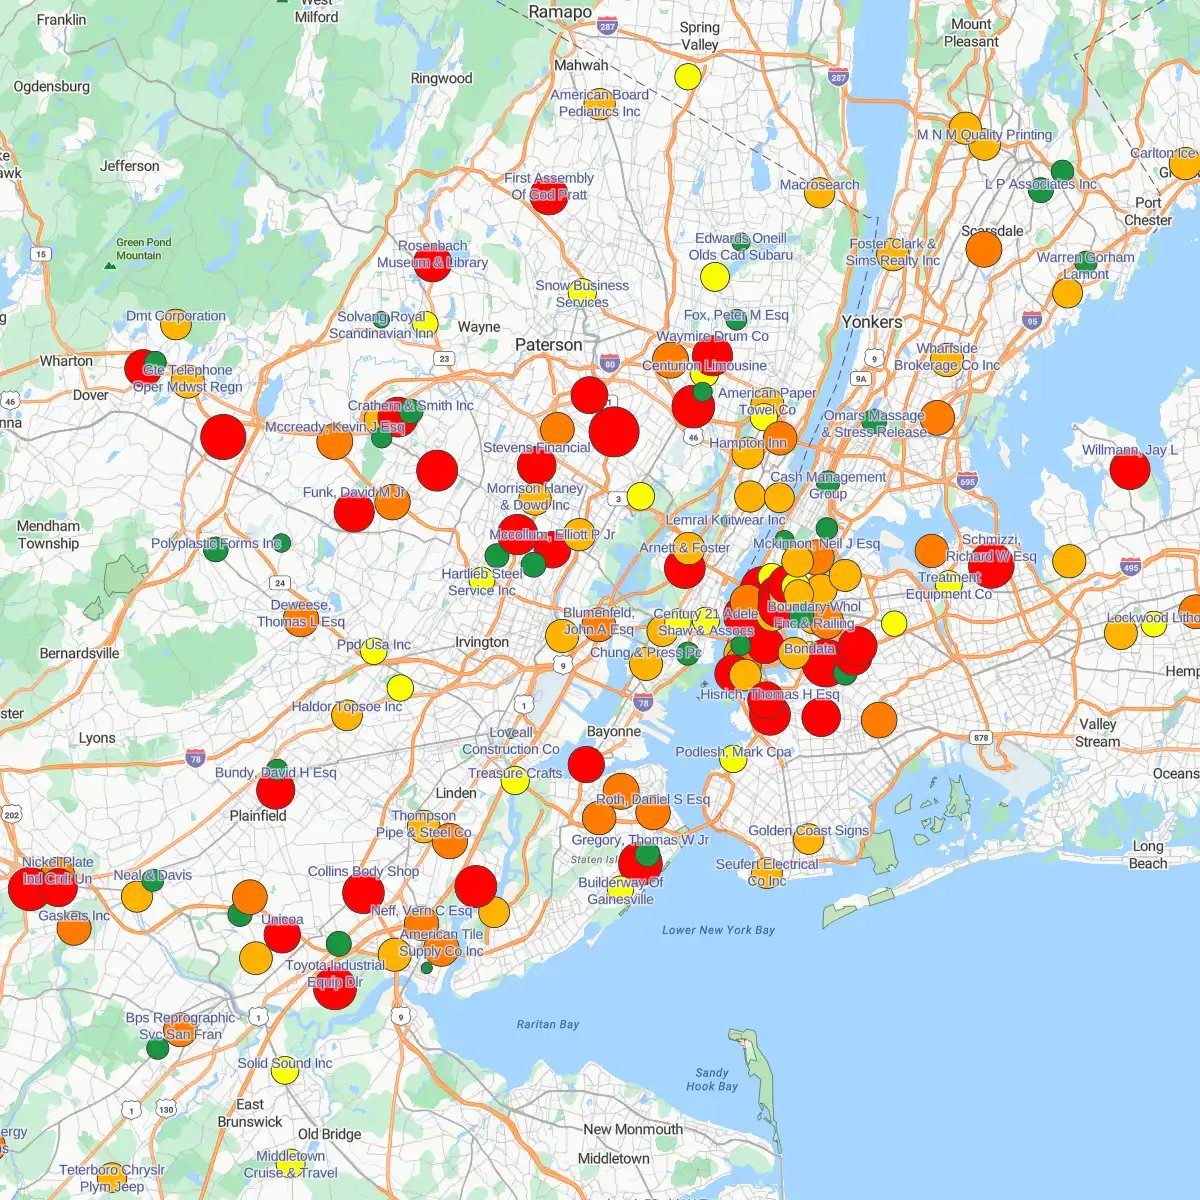
Proportional Bubble Maps

Core Capability

Sized markers reflecting pipeline value, account revenue, or machine volume.

Primary Sales Leadership Use Case

Prioritizing tier-1 accounts during territory rebalancing and quota setting.

Commercial Impact & ROI Metric

Focuses field resources strictly on top-tier revenue potential.

Pin map, New York

Pin & Account Maps

Core Capability

Sized markers reflecting pipeline value, account revenue, or machine volume.

Primary Sales Leadership Use Case

Prioritizing tier-1 accounts during territory rebalancing and quota setting.

Commercial Impact & ROI Metric

Focuses field resources strictly on top-tier revenue potential.

Enterprise Proof Points


Commercial leaders across global enterprise organizations leverage visual location intelligence to drive top-line revenue and operational efficiency:

Engineers working near heavy machinery

Thermo Fisher Scientific

Deployed visual location intelligence to reorganize specialized sales units and optimize account coverage live in front of stakeholders, unlocking $30,000,000 in previously untapped sales potential.

Superglue being applied to screw thread

Henkel

Supplemented distributor reliance with direct, map-based territory planning. By arming sales reps with visual maps of verified prospects grouped by product line, Henkel cut new rep onboarding time by 67% and reclaimed 30% of field selling time.

Corporate office buildings

Siemens

Slashed complex sales territory realignment cycles from weeks of tedious spreadsheet work down to just a few hours, eliminating data-crunching bottlenecks and protecting field selling hours during organizational shifts.

Cement mixer in front of construction site

Lauren Concrete

Mapped exact material and transportation costs rather than simple geographic distance, eliminating proximity bias to unlock $1,700,000 in operational and shipping savings.

Woman driving with route map on phone

Major Manufacturing Enterprise

Balanced inside and outside rep workloads based on active installation density, capturing a baseline 3% top-line revenue lift.

Executive Evaluation:
Pros & Cons Analysis


Investing in mapping software requires an honest evaluation of the strategic returns against real organizational friction. Sales leaders must justify capital allocation to the CRO and CFO while ensuring seamless field adoption.

Uncapped
Revenue Expansion:

Visualizing account whitespace and density reveals hidden market opportunities, consistently delivering a 7% revenue expansion through rightsized market coverage.

Reclaimed
Selling Capacity

Transitioning reps from reactive travel to compact, drive-time-optimized territories boosts in-person field face-time by 20% to 30%.

Elimination of
Cultural & Political Friction

Realigning territories live on an interactive map using an objective Workload Index proves fair distribution to reps and managers, eliminating commission disputes and preserving sales team morale.

Faster Time-to-Revenue
for New Hires

Equipping new reps with visual territory maps accelerates territory familiarity, cutting onboarding timelines by up to 67%.

Adoption Concerns & Risk Mitigations


1
Concern 1

Software Cost & ROI Justification

The Fear: Adding another software line item will draw scrutiny from Finance during budget reviews.

The Mitigation: Unlike back-office admin tools, location intelligence directly impacts top-line revenue and field efficiency. A team of 60 reps reclaiming lost travel miles generates over $77,000 in direct fuel savings alone, while a 3% to 7% top-line revenue lift delivers immediate multiple payback on software licensing.

2
Concern 2

Steep Learning Curves & Software Fatigue

The Fear: Reps and sales managers are exhausted by complex software setups that require technical GIS expertise.

The Mitigation: Business-first mapping platforms are built specifically for non-technical sales leaders. Furthermore, select enterprise providers eliminate onboarding lag by providing dedicated human experts to handle initial data setup, territory design, and training—guaranteeing rapid adoption without relying on self-service chatbots.

3
Concern 3

CRM Data Sync & Operational Disruption

The Fear: Exporting and importing static CSV files between CRMs and mapping tools will corrupt account assignments or create out-of-sync records.

The Mitigation: Mandate bi-directional synchronization with Salesforce CRM. Approved territory modifications and account reassignments written on the map update Salesforce standard and custom territory objects automatically in real time.

The Sales Leader's
Selection Checklist


When evaluating location intelligence and territory mapping platforms, sales leaders should use the following operational criteria to ensure the software drives adoption and commercial impact:

Evaluation Area

Do - Mandatory Capability

Don't - Operational Risk

CRM Integration

Require direct, bi-directional synchronization with Salesforce CRM so territory changes write back to standard objects automatically.

Settle for manual CSV exports and static file uploads that lead to stale data and CRM disconnects.

Workload Balancing

Demand a multi-variable Workload Index that factors account count, active pipeline, call frequency, and actual drive times.

Accept basic tools that balance solely on zip code counts or raw account numbers, ignoring travel drag.

Travel Calculation

Mandate true Isochrone drive-time routing based on actual road networks, speed limits, and traffic patterns.

Rely on straight-line "as-the-crow-flies" radial buffers that miscalculate field travel reality.

Scenario Modeling

Insist on live, interactive "what-if" modeling to adjust boundaries and view instant workload recalculations during meetings.

Accept platforms that require hours of processing time or manual rework between scenario iterations.

Vendor Support

Select providers offering fully inclusive, human-first onboarding experts to build initial maps and train teams.

Accept vendor models that leave your team stranded with automated chatbots or costly third-party consulting fees.

The Path Forward


Spreadsheets and standard CRM dashboards provide a clear view of what has occurred in a sales pipeline, but they are blind to where revenue growth sits and how field capacity is constrained.

For sales leaders tasked with hitting ambitious targets, reducing rep turnover, and eliminating travel waste, location intelligence provides the essential visual foundation. By converting raw CRM records into dynamic, balanced territories, commercial leaders protect rep selling time, build organizational consensus, and turn geographic insight into a repeatable growth engine.

Ready to see your "Full Potential"?

Other Guides


You appear to be offline at the moment, this notice will disappear once your device can connect to the internet again