How to apply a Filter to your dataset
You can apply filters to your map to further analyze the data. Filters allow you to dig deep into your data. For example you can filter by customers in a specific area with a certain income.
There are three types of filter.
- Numerical
- Text
- Date
Numerical Filters
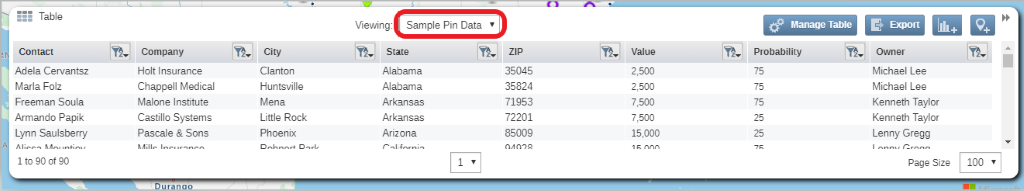
By default the Table will be collapsed in the bottom right corner of the screen as seen below.

- Click on the double arrows to expand it.
- Select the dataset you wish to filter from the Viewing drop down.
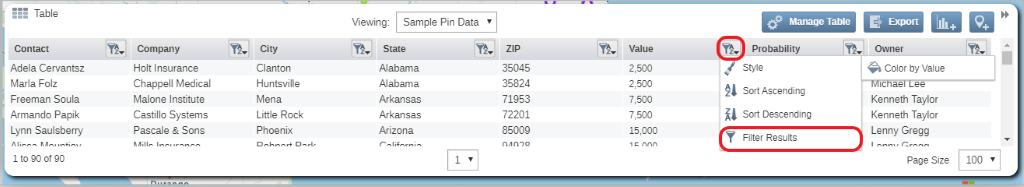
- Select the Sort/Filter button at the top of the column you wish to filter. This will open the Filter window beside the table.
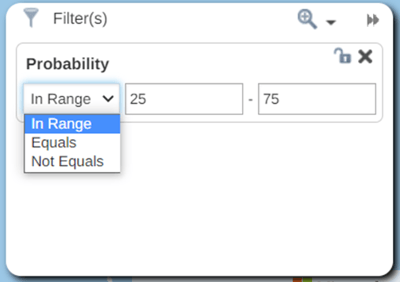
- Click on the dropdown and select the criteria you want and enter the appropriate value in the text box.
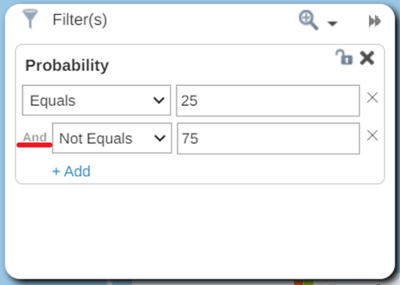
- You can filter by a Range of values or Equals and Not Equals options.
NOTE: When adding a second/ subsequent NOT EQUALS filter, the filters will use AND logic
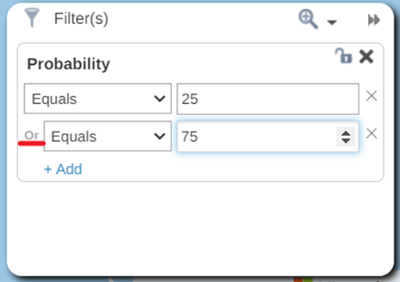
NOTE: When adding a second/ subsequent EQUALS filter, the filters will use OR logic
Text Filters
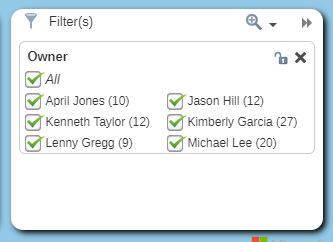
If the Column is a text field and has less than 50 distinct values then the filter window will appear as below. This will allow you to choose one or more values.
- Click on All to remove or add all results to the map.
- Click on one or more choices to add or remove them from the map.
- Click on the X icon to remove the filter.
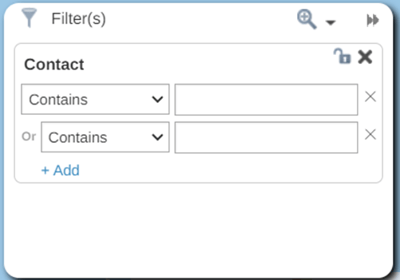
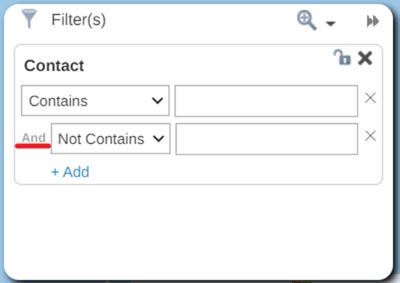
If the Column is a text field and has more than 50 distinct values then the filter window will appear as below.
- Click on the drop down and select the criteria you want and enter the appropriate value in the text box.
- Click on the + to add another filter or click on the smaller x icon to remove an individual filter.
- Click on the larger X icon to remove the whole filter.
NOTE: When adding a second/ subsequent NOT CONTAINS, NOT EQUALS or IS NOT EMPTY filter, the filters will use AND logic
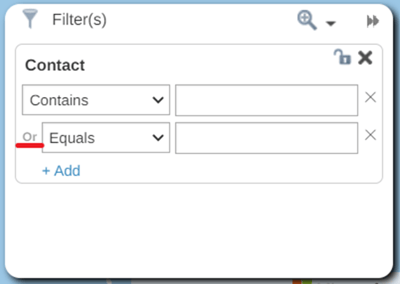
NOTE: When adding a second/ subsequent CONTAINS, EQUALS or IS EMPTY filter, the filters will use OR logic
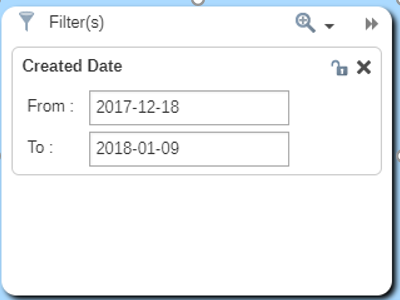
Date Filters
- You can filter based on date values and date ranges. Make sure that the data has been imported as a date at the add data stage.
- You can filter data directly from the legend by clicking on the eye icon beside each range.
- You can filter from the table by clicking on the filter icon at the top right of the date column.
- Use the ‘From’ and ‘To’ date to specify the start and end date of the data you want to view.